| Strain Name |
C57BL/6-Glp1rtm1(GLP1R)Bcgen/Bcgen
|
Common Name | B-hGLP1R mice |
| Background | C57BL/6 | Catalog number | 170164 |
|
Related Genes |
GLP-1; GLP-1R; GLP-1-R | ||
|
NCBI Gene ID |
14652 | ||
Protein expression analysis

IHC for human GLP1R expression. Pancreata from wild-type (+/+) and B-hGLP1R mice (H/H) were stained using an antibody specific for human GLP1R. and only the pancreas from B-hGLP1R mice (H/H) showed hGLP1R positive signal in plasma membrane.
Human GLP1R Protein expression analysis

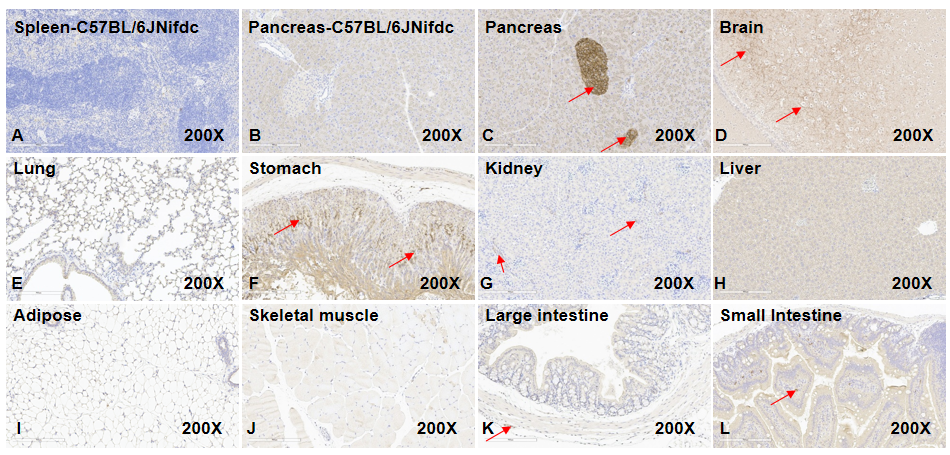
Human GLP1R expression in different tissues of B-hGLP1R mice by IHC. Tissues were stained with human-specific antibodies GLP1R (B-L). The spleen of wild-type C57BL/6JNifdc mice was tissue-negative control (A). The Pancreas of C57BL/6JNifdc mice shows human GLP1R negative (B). The islet of the pancreas, striatum septum of brain, gastric mucosal layer and myenteric plexus of stomach, partial blood vessels the kidney, the muscularis propria nerve plexus of both large intestine and small intestine, and the interstitial cells of the small intestine mucosal layer of B-hGLP1R mice show human GLP1R positive (C, D, F, G, K, L). Lung, liver, adipose, and skeletal muscle of B-hGLP1R mice show human GLP1R negative. Original magnification ×200. Abbreviations: IHC, immunohistochemistry.
Mouse GLP1R Protein Expression Analysis of B-hGLP1R mice

Representative mouse GLP1R expression in different tissues of B-hGLP1R mice by IHC. Tissues were stained with mouse-specific antibodies GLP1R (B-H). The human pancreas tissue negative control (A). The pancreas and brain of wild-type C57BL/6JNifdc mice showed mouse GLP1R positive (C, D). The lung tissue of wild-type C57BL/6JNifdc mice showed mouse GLP1R negative (E). The pancreas, brain, and lung of B-hGLP1R mice showed mouse GLP1R negative (F, G, H). Original magnification ×200. Abbreviations: IHC, immunohistochemistry.

PF-06882961 improved glucose tolerance and promote insulin secretion in B-hGLP1R mice. B-hGLP1R mice were treated with PF-06882961 for 3 mg/kg, s.c. Then the glucose tolerance test was performed in C57BL/6 and B-hGLP1R mice for 2g/kg D-Glucose is administered by intraperitoneal injection (IPGTT). (A) Blood glucose. (B) Area under the curve (AUC) for IPGTT. (C) Plasma insulin. (D) Area under the curve (AUC) for the plasma insulin. As shown, glucose tolerance was improved by PF-06882961 in B-hGLP1R mice but not in wild-type C57BL/6 mice, and promote plasma insulin secretion in B-hGLP-1R mice. Values are expressed as mean ± SEM. Significance was determined by the Unpaired t test. (*P < 0.05, **P < 0.01, ***P < 0.0001)

Study of PF-06882961 and Semaglutide in B-hGLP1R mice food intake. B-hGLP1R mice (male, 12-week-old, n=8) were acclimated to handing and oral gavage vehicle for 3 days before study. Mice were grouped by body weight and daily food intake. Subsequently, the mice were treated with dose and route shown in the figure. Food weights were measured on 2.5, 5.5, 15.5 hours after treatment. Values are expressed as mean ± SEM. Significance was determined by the Ordinary one-way ANOVA . (*P < 0.05, **P < 0.01, ***P < 0.0001)
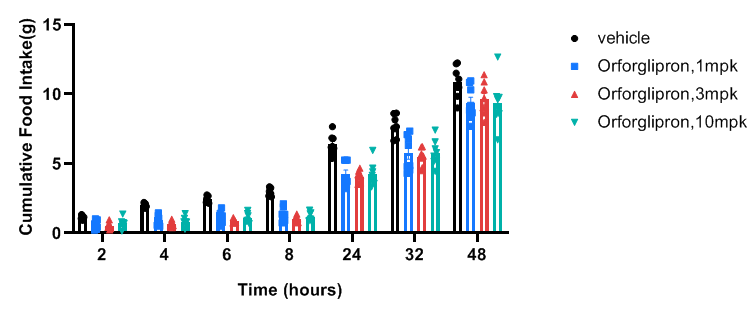
Effects of Orforglipron on food intake of B-hGLP1R mice

Study of Orforglipron in B-hGLP1R mice food intake. B-hGLP1R mice (9-week-old) were acclimated for QD PO dosing with vehicle for 4 days, and mice were grouped by body weight and daily food intake. All animals will be placed in clean cages and fasted overnight, mice will be dosed with vehicle or test compound in the morning (before 10AM). All group's food will be added 15 minutes post dosing, and food remaining will be recorded at 2-,4-,6-,8-, 24-, 32-, and 48h post dosing. Values are expressed as mean ± SEM.

Efficacy study of Semaglutide in HFD induced B-hGLP1R mice. B-hGLP1R mice were fed with a high-fat diet for 12 weeks to induce mice obesity. (A) Body weight change after HFD induction. (B-D) Body weight change after Semaglutide treatment. (E-F) Effect of semaglutide on food intake. 8-10 mice per group. Values are expressed as mean ± SEM. Significance was determined by the Ordinary one-way ANOVA. *p<0.05, **p<0.01,***p<0.001 ,****p<0.0001.

Efficacy study of Semaglutide in HFD induced B-hGLP1R mice. (A) Blood glucose change after Semaglutide treatment. (B) The glucose tolerance test for 2g/kg D-Glucose is administered by intraperitoneal injection (IPGTT). (C) Area under the curve (AUC) for the IPGTT. 8-10 mice per group. Values are expressed as mean ± SEM. Significance was determined by the Ordinary one-way ANOVA. *p<0.05, **p<0.01,***p<0.001 ,****p<0.0001.

Efficacy study of Semaglutide in HFD induced B-hGLP1R mice. (A-F) Blood biochemical analysis after treatment. 8-10 mice per group. Values are expressed as mean ± SEM. Significance was determined by the Ordinary one-way ANOVA. *p<0.05, **p<0.01, ***p<0.001, ****p<0.0001.

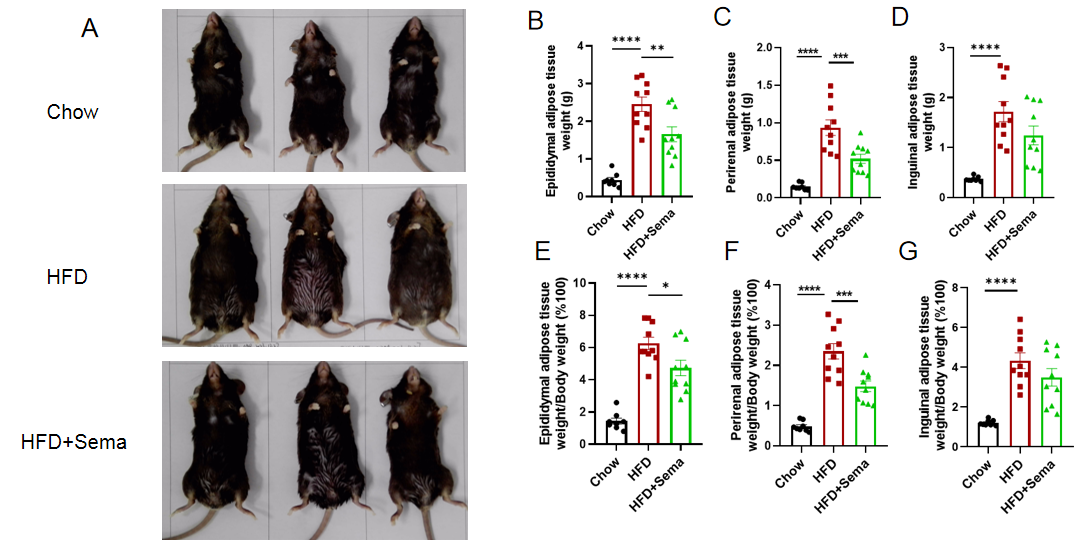
Efficacy study of Semaglutide in HFD induced B-hGLP1R mice.(A) Representative pictures of different groups at termination. (B-D) Adipose tissue weights after treatment. (E-G) Ratios of adipose tissue weight and body weight. 8-10 mice per group. Values are expressed as mean ± SEM. Significance was determined by the Ordinary one-way ANOVA. *p<0.05, **p<0.01, ***p<0.001, ****p<0.0001.

Analysis of spleen leukocyte subpopulations by FACS. Splenocytes were isolated from female C57BL/6 and B-hGLP1R mice (n=3, 9-week-old). Flow cytometry analysis of the splenocytes were performed to assess leukocyte subpopulations. A. Representative FACS plots. Single live cells were gated for the CD45+ population and used for further analysis as indicated here. B. Results of FACS analysis. Percent of T cells, B cells, NK cells, monocytes, dendritic cells, granulocytes and macrophages in homozygous B-hGLP1R mice were similar to those in the C57BL/6 mice, demonstrating that GLP1R humanized does not change the overall development, differentiation or distribution of these cell types in spleen. Values are expressed as mean ± SEM.

Analysis of blood leukocyte subpopulations by FACS. Blood cells were isolated from female C57BL/6 and B-hGLP1R mice (n=3, 9-week-old). Flow cytometry analysis of the blood cells were performed to assess leukocyte subpopulations. A. Representative FACS plots. Single live cells were gated for the CD45+ population and used for further analysis as indicated here. B. Results of FACS analysis. Percent of T cells, B cells, NK cells, monocytes, dendritic cells, granulocytes and macrophages in homozygous B-hGLP1R mice were similar to those in the C57BL/6 mice, demonstrating that GLP1R humanized does not change the overall development, differentiation or distribution of these cell types in blood. Values are expressed as mean ± SEM.

Analysis of lymph node leukocyte subpopulations by FACS. Lymph node were isolated from female C57BL/6 and B-hGLP1R mice (n=3, 9-week-old). Flow cytometry analysis of the lymph node were performed to assess leukocyte subpopulations. A. Representative FACS plots. Single live cells were gated for the CD45+ population and used for further analysis as indicated here. B. Results of FACS analysis. Percent of T cells, B cells and NK cells in homozygous B-hGLP1R mice were similar to those in the C57BL/6 mice, demonstrating that GLP1R humanized does not change the overall development, differentiation or distribution of these cell types in lymph node. Values are expressed as mean ± SEM.


Analysis of T cell subpopulation in spleen, blood and lymph node. The lymphocytes were isolated from spleen, lymph node and blood in C57BL/6 and B-hGLP1R mice (n=3, 9-week-old). The proportion of T cells subpopulation was tested by flow cytometry. There were no differences between C57BL/6 and B-hGLP1R mice, demonstrating that humanized of GLP1R does not change the overall development, differentiation or distribution of these T cell subtypes. Values are expressed as mean ± SEM.

Blood chemistry tests of B-hGLP1R mice. Serum from the C57BL/6 and B-hGLP1R mice (n=6, 6-8 week-old) was collected and analyzed for levels of indicators. The measurements of B-hGLP1R mice were similar to that in C57BL/6 mice. Values are expressed as mean ± SEM.


 京公网安备: