| Strain Name |
C57BL/6JNifdc-Inhbetm1(INHBE)Bcgen/Bcgen
|
Common Name | B-hINHBE mice |
| Background | C57BL/6JNifdc | Catalog number |
112773 |
|
Aliases |
Inhbe |
||
|
NCBI Gene ID |
16326 | ||
Description
- INHBE encodes a member of the TGF-beta (transforming growth factor-beta) superfamily of proteins. The encoded preproprotein is proteolytically processed to generate an inhibin beta subunit. Inhibins have been implicated in regulating numerous cellular processes including cell proliferation, apoptosis, immune response and hormone secretion. This gene may be upregulated under conditions of endoplasmic reticulum stress, and this protein may inhibit cellular proliferation and growth in pancreas and liver.
- INHBE is a growth factor that belongs to the transforming growth factor-β (TGF-β) family. INHBE mRNA is predominantly expressed in the liver, and INHBE is involved in the regulation of liver cell growth and differentiation. Inhibin βE (INHBE) was identified as a novel putative hepatokine with hepatic gene expression that positively correlated with insulin resistance and body mass index in humans. Treatment with siINHBE suppressed body weight gain during the two-week experimental period, which was attributable to diminished fat rather than lean mass.
- The exons 1-2 of mouse Inhbe gene that encode the whole molecule (ATG to STOP codon), including 3’UTR were replaced by human counterparts in B-hINHBE mice. The promoter and 5’UTR region of the mouse gene are retained. The human INHBE expression is driven by endogenous mouse Inhbe promoter, while mouse Inhbe gene transcription and translation will be disrupted.
- The mice can be used for preclinical pharmacodynamics studies of target-related diseases.
Targeting strategy
mRNA expression analysis

Protein expression analysis

Western blot analysis of INHBE protein expression in homozygous B-hINHBE mice. Serum lysates were collected from wild-type C57BL/6 mice (+/+) and homozygous B-hINHBE mice (H/H), and then analyzed by western blot with anti-INHBE antibody. 20 μg (for INHBE) or 8 μg (for Transferrin) total proteins were loaded for western blotting analysis. INHBE was detected in serum of wild-type mice and homozygous B-hINHBE mice, as the antibody is cross-recognize both human and mouse INHBE.

INHBE expression in homozygous B-hINHBE mice. (A) Various tissue lysates were collected from wild-type C57BL/6 mice (+/+) and homozygous B-hINHBE mice (H/H), and then analyzed by western blot with anti-INHBE antibody. 40 μg total proteins were loaded for western blotting analysis. INHBE was detected in liver and kidney of wild-type mice and homozygous B-hINHBE mice, as the antibody cross-recognized both human and mouse INHBE. (B) hINHBE mRNA expression in kidney and liver by RT-qPCR.
mRNA expression analysis


The inhibitory efficiency of the nucleic acid drugs against human INHBE

The inhibitory efficiency of the nucleic acid drugs against human INHBE in B-hINHBE mice. B-hINHBE mice were randomly divided into two groups (Female, 10 weeks old). The human INHBE targeted nucleic acid drugs (synthesized according to patents) and PBS were administered to the mice individually. The nucleic acid drug was administered in the form of PBS aqueous solution. The mice were sacrificed on day 14, and the liver tissue was collected to detect the expression level of human INHBE mRNA by qPCR. (Fasting for 16 hours before liver collection.) (A) The schematic diagram of experimental processing. (B) The expression of human INHBE mRNA in the liver. The human INHBE in the siRNA group was significantly reduced compared to the control group. Values are expressed as mean ± SEM. Significance was determined by t-test, **p < 0.01.

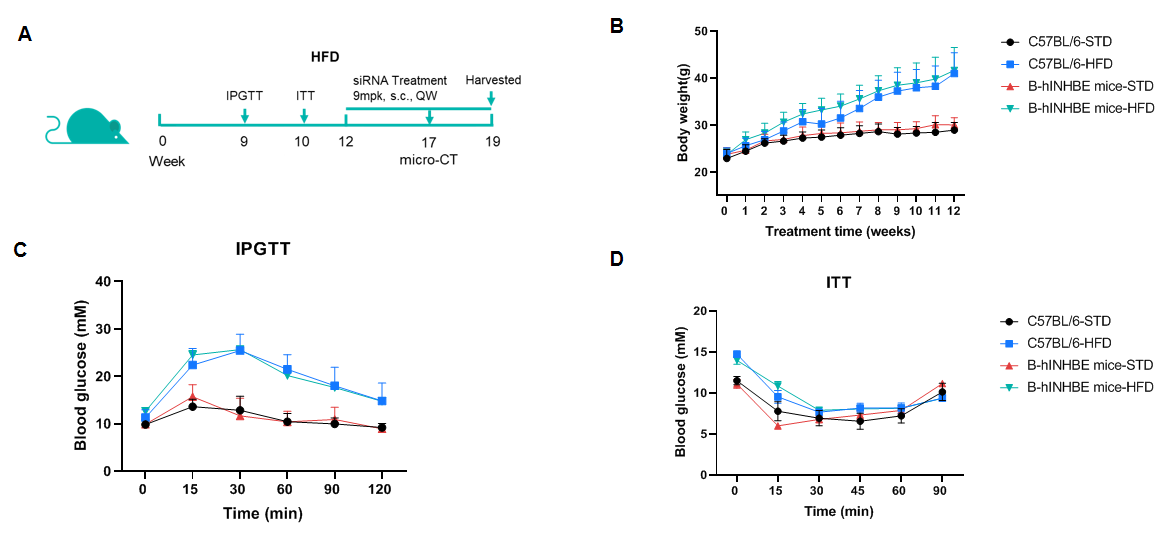
High-Fat Diet-Induced B-hINHBE mice. C57BL/6 and B-hINHBE mice (male, 7 weeks old) were fed with high-fat diet (60 kcal% Fat) for 12 weeks to induce obesity. (A) The schematic diagram of experimental processing (B) Body weight after HFD induction. (C) After fasting for 6 hours, mice were intraperitoneally injected with 15% Glucose (1.5 g/kg) for Glucose Tolerance Tests on 9 weeks. (D) After fasting for 4 hours, mice were intraperitoneally injected with 0.5 U/kg insulin for Insulin Tolerance Test.
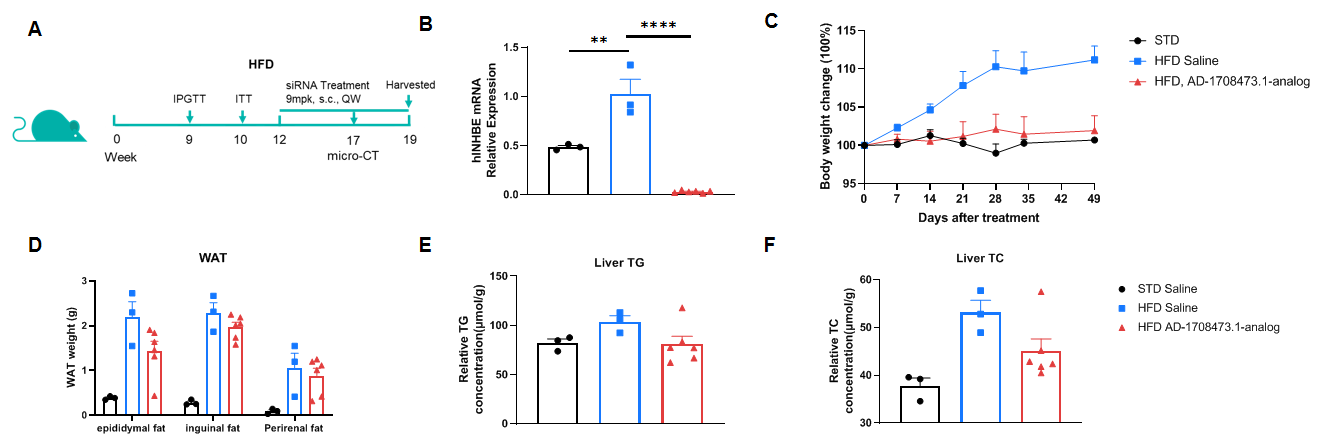

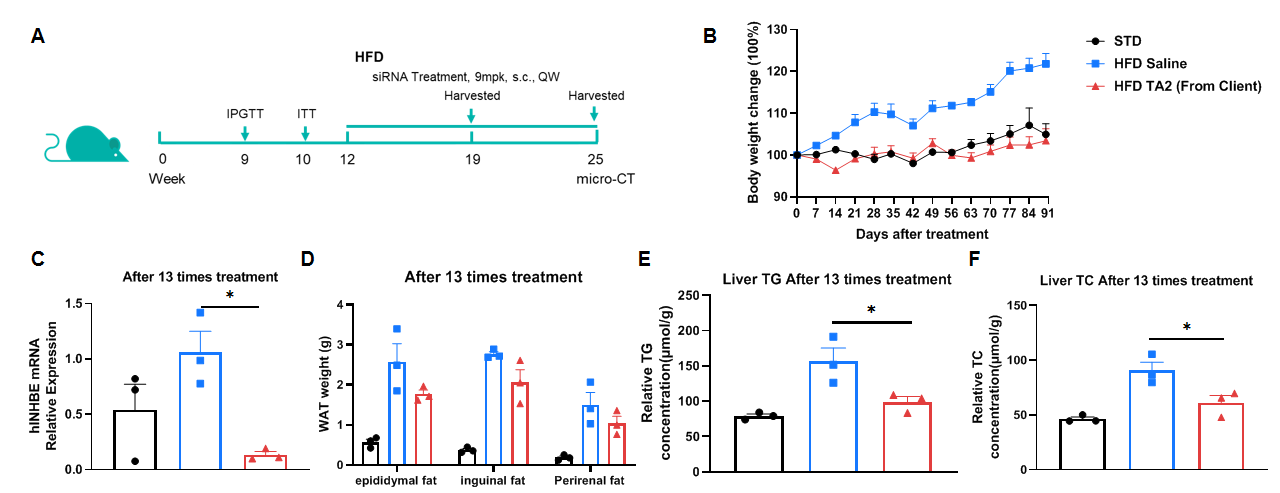
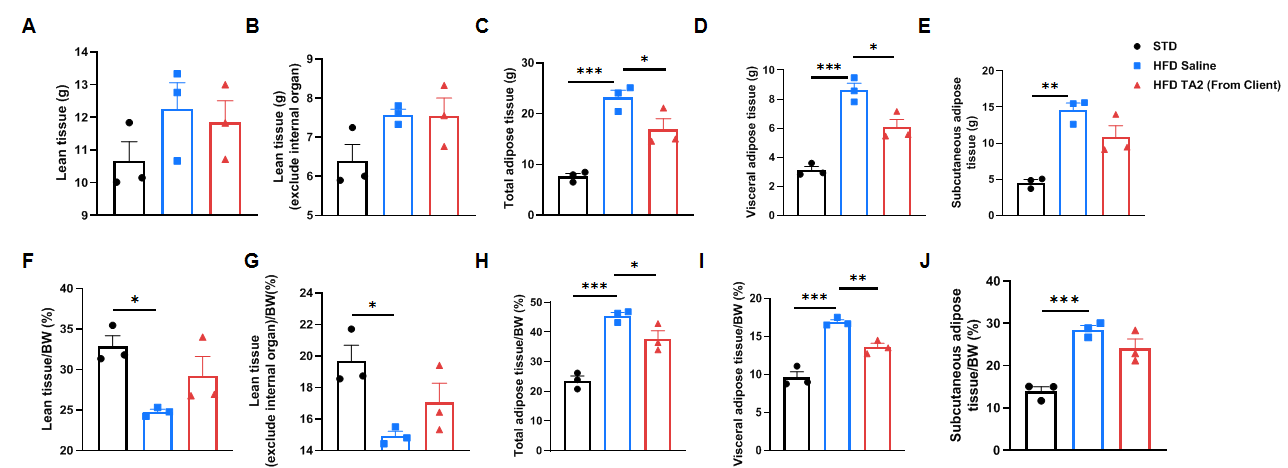
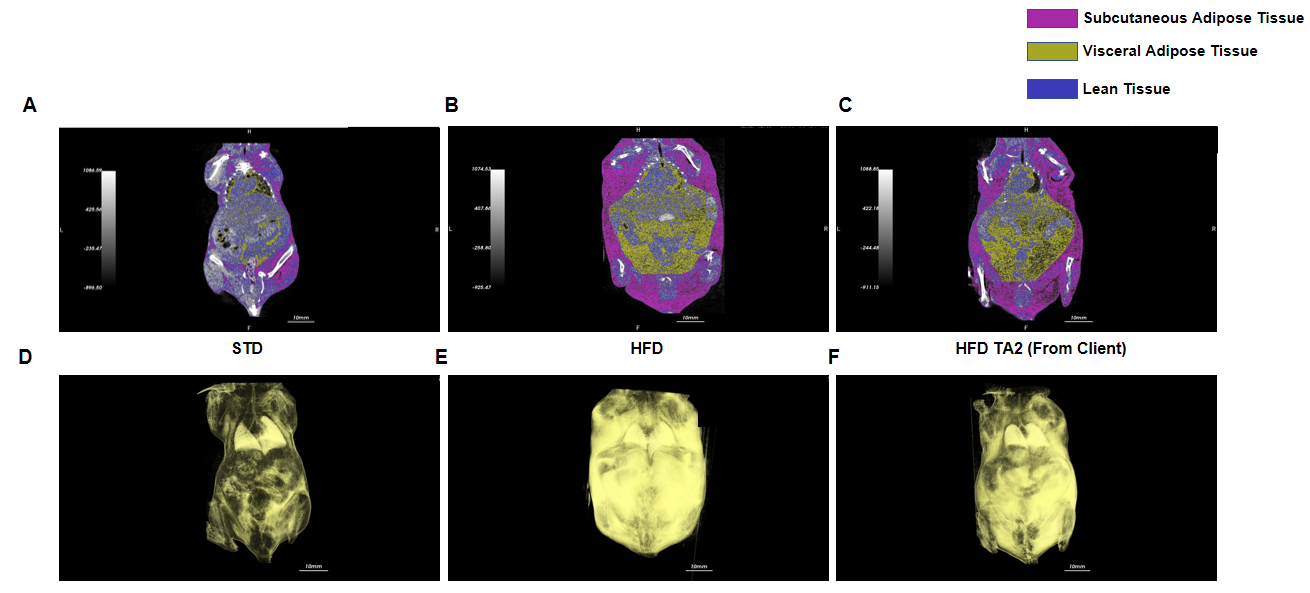
Efficacy study of INHBE-siRNA in HFD-induced B-hINHBE mice. The 3D reconstruction analysis of lean tissue and adipose tissue by micro-CT after 6 times treatment. (A-E) The weight of lean tissue, lean tissue which excludes internal organs, total adipose tissue, visceral adipose tissue, and subcutaneous adipose tissue. (F-J) The percentages of lean tissue, lean tissue which excludes internal organs, total adipose tissue, visceral adipose tissue, and subcutaneous adipose tissue with the mouse body weight. Analyzed by one way-ANOVA, *P<0.05, **P<0.01, ***P<0.001, ****P<0.0001.


 京公网安备: