| Strain Name |
C57BL/6-Tnfsf15tm2(TNFSF15)Bcgen Il23atm1(IL23A)Bcgen
|
Common Name | B-hTL1A/hIL23A/hIL12B mice |
| Background | C57BL/6 | Catalog number | 113038 |
|
Related Genes |
TL1, TL1A, TNLG1B, VEGI, VEGI192A; IL-23, IL-23A, IL23P19, P19, SGRF; CLMF, CLMF2, IL-12B, IMD28, IMD29, NKSF, NKSF2; |
||
|
NCBI Gene ID |
9966, 51561, 3593 | ||
- TL1A binds to death receptor 3 (DR3) to provide stimulatory signals for downstream signaling pathways, thereby regulating the proliferation, activation, apoptosis of effector cells, and the production of cytokines and chemokines. Soluble decoy receptor 3 (DcR3) may neutralize the effects of sTL1A/DR3. In addition, DcR3 can inhibit apoptosis, reduce inflammation, and prevent tissue damage by neutralizing LIGHT and FasL.
- IL-23 is a heterodimeric cytokine composed of p40 and p19 subunits, primarily produced by macrophages and dendritic cells. IL-23 binds to its receptor IL-23R, which regulates the release of downstream pro-inflammatory cytokines.
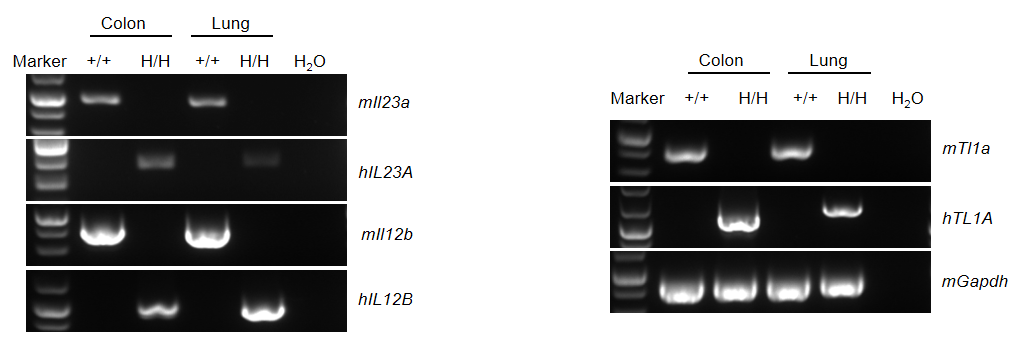
- The genome of the mouse Tl1a gene encoding the extracellular domain was replaced with its human TL1A counterpart in B-hTL1A/hIL23A/hIL12B mice. The genome of the mouse Il23a gene encoding the full-length protein was replaced with human IL23A counterpart in B-hTL1A/hIL23A/hIL12B mice. The genome of the mouse Il12b gene encoding the full-length protein was replaced with human IL12B counterpart in B-hTL1A/hIL23A/hIL12B mice.
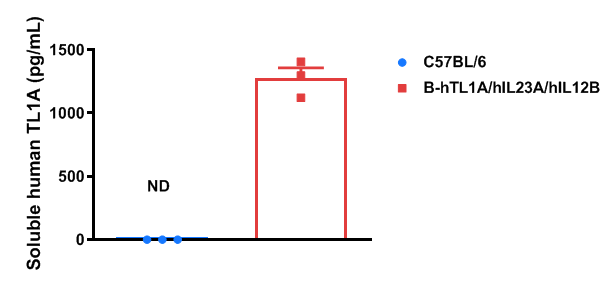
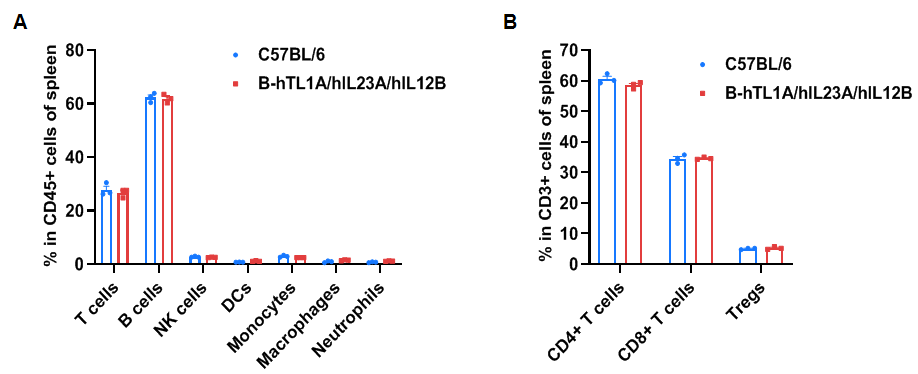
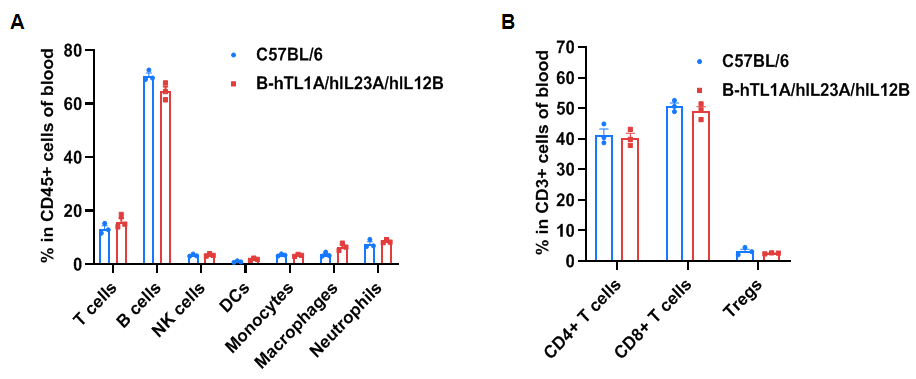
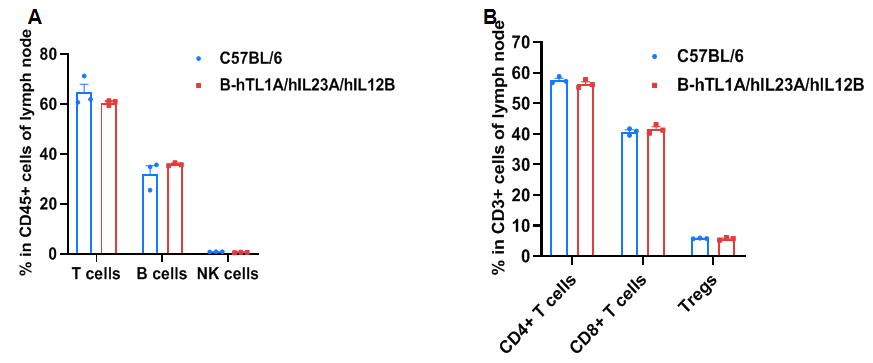
- Soluble human TL1A and human IL23 were exclusively detectable in homozygous B-hTL1A/hIL23A/hIL12B mice, but not in WT mice. Humanization of TL1A, IL23A and IL12B do not change the overall frequency or distribution of immune cell types in spleen, blood and lymph nodes. Humanization of TL1A, IL23A and IL12B do not change the blood cell composition and morphology, ALT and AST levels or health of liver.
- This product is used for pharmacological and safety evaluation of autoimmune diseases such as Inflammatory bowel disease, psoriasis and arthritis.
mRNA expression analysis in humanized B-hTL1A/hIL23A/hIL12B mice

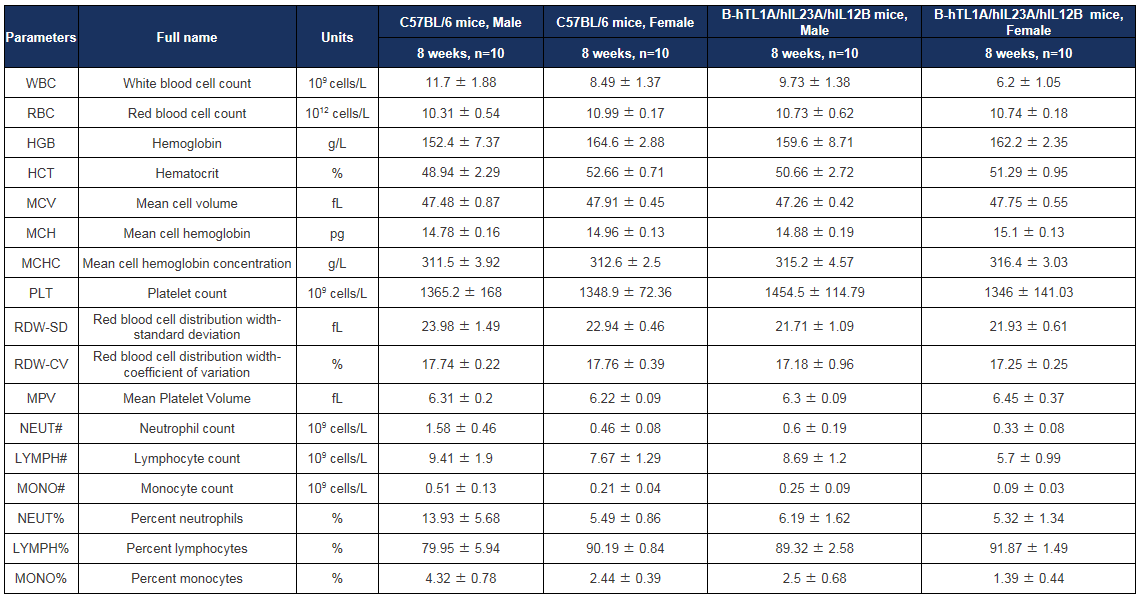
Complete blood count (CBC) of B-hTL1A/hIL23A/hIL12B mice. Values are expressed as mean ± SD.

Biochemical test of B-hTL1A/hIL23A/hIL12B mice. Values are expressed as mean ± SD.
TNBS induced acute colitis in B-hTL1A/hIL23A/hIL12B mice

TNBS induced acute colitis in B-hTL1A/hIL23A/hIL12B mice

TNBS solution was instilled into the colon lumen of B-hTL1A/hIL23A/hIL12B mice (female, 8-10 weeks-old, n=10). The control group (Sham) received intrarectal injections of 50% ethanol. The treatment groups received anti-human TL1A antibody Tulisokibart (10 mpk, provided by WuXi AppTec), anti-human IL23p19 antibody Risankizumab (10 mpk, provided by WuXi AppTec) alone or in combination. On day 5, the mice were sacrificed, and the colon tissue was used for H&E staining and Masson staining. (A) Pathological score. (B) Masson staining score. A TNBS-induced acute colitis model was established in B-hTL1A/hIL23A/hIL12B mice. Administration of anti-human TL1A antibody Tulisokibart and anti-human IL23p19 antibody Risankizumab effectively ameliorated colonic pathological damage and fibrotic progression in TNBS-induced acute colitis mice, and their combination provided better efficacy. The results indicate that B-hTL1A/hIL23A/hIL12B mice are a powerful tool for evaluating in vivo efficacy of the combination of anti-human TL1A antibody and anti-human IL23p19 antibody. Values are expressed as mean ± SEM. *p<0.05, **p<0.01, ***p<0.001, ****p<0.0001, versus Vehicle, ANOVA.
Note: This experiment was conducted by WuXi AppTec using in B-hTL1A/hIL23A/hIL12B mice.

TNBS solution was instilled into the colon lumen of B-hTL1A/hIL23A/hIL12B mice (female, 8-10 weeks-old, n=10). The control group (Sham) received intrarectal injections of 50% ethanol. The treatment groups received anti-human TL1A antibody Tulisokibart (10 mpk, provided by WuXi AppTec), anti-human IL23p19 antibody Risankizumab (10 mpk, provided by WuXi AppTec) alone or in combination. On day 5, the mice were sacrificed, and the intestinal mucosa and serum were collected for cytokine analysis. (A) The concentrations of IL-1β, IL-6, IL-17A, IFN-γ, TNF-α in intestinal mucosa. (B) The concentrations of IL-1β, IL-6, IL-17A, IFN-γ, TNF-α in serum. A TNBS-induced acute colitis model was established in B-hTL1A/hIL23A/hIL12B mice. Administration of anti-human TL1A antibody Tulisokibart and anti-human IL23p19 antibody Risankizumab markedly reduced the production of inflammatory cytokines in TNBS-induced acute colitis mice, and their combination provided better efficacy. The results indicate that B-hTL1A/hIL23A/hIL12B mice are a powerful tool for evaluating in vivo efficacy of the combination of anti-human TL1A antibody and anti-human IL23p19 antibody. Values are expressed as mean ± SEM. *p<0.05, **p<0.01, ***p<0.001, ****p<0.0001, versus Vehicle, ANOVA.
Note: This experiment was conducted by WuXi AppTec using in B-hTL1A/hIL23A/hIL12B mice.


 京公网安备: