|
Strain Name
|
NOD.CB17-PrkdcscidIl2rgtm1BcgenIl15tm1(IL15)BcgenFcgr1tm1Bcgen
Fcgr2btm1BcgenFcgr4tm1BcgenFcgr3tm1Bcgen/Bcgen
|
Common Name
|
B-NDG hIL15, FcγR KO mice
|
|
Background
|
B-NDG mice
|
Catalog number
|
112653
|
Aliases
|
IL15: IL-15
Fcgr1: CD64, FcgammaRI, IGGHAFC
Fcgr2b: CD32, F630109E10Rik, Fc[g]RII, FcgRII, Fcgr2, Fcgr2a, Fcr-2, Fcr-3, Ly-17, Ly-m20, LyM-1, Lym-1, fcRII
Fcgr4: 4833442P21Rik, CD16-2, FcgRIV, FcgammaRIV, Fcgr3a, Fcrl3
Fcgr3: CD16
|
Protein expression analysis

Strain specific FcγRs expression analysis in homozygous B-NDG hIL15 mice and B-NDG hIL15, FcγR KO mice by flow cytometry. Spleens were collected from homozygous B-NDG hIL15 mice and B-NDG hIL15, FcγR KO mice, and analyzed by flow cytometry with four species-specific anti-FcγR antibodies. Mouse FcγRI, FcγRIIb, FcγRIII and FcγRIV were detectable in B-NDG hIL15 mice but not in B-NDG hIL15, FcγR KO mice.
Protein expression analysis

Strain specific IL15 expression analysis in B-NDG mice, homozygous B-NDG hIL15 mice and B-NDG hIL15, FcγR KO mice by ELISA. Serum was collected from male B-NDG mice (9-week-old) , homozygous B-NDG hIL15 mice (9-week-old) and B-NDG hIL15, FcγR KO mice (12-week-old), and analyzed by ELISA with species-specific IL15 antibody. Human IL15 was detectable in homozygous B-NDG hIL15 mice and B-NDG hIL15, FcγR KO mice but not in B-NDG mice. The expression level in B-NDG hIL15, FcγR KO mice was similar to that in B-NDG hIL15 mice.
Analysis of leukocyte subpopulations in blood

Analysis of blood leukocyte subpopulations by flow cytometry. Blood were isolated from male B-NDG hIL15 mice and B-NDG hIL15, FcγR KO mice (n=3). Flow cytometry analysis of the leukocytes was performed to assess leukocyte subpopulations. A. Representative FACS plots. Single live cells were gated for the CD45+ population and used for further analysis as indicated here. B. Results of FACS analysis. Percent of granulocytes, monocytes, macrophages and DCs in homozygous B-NDG hIL15, FcγR KO mice were similar to those in the B-NDG hIL15 mice, demonstrating that knock out of FcγRs does not change the overall development, differentiation or distribution of these cell types in blood. Values are expressed as mean ± SEM.
Analysis of leukocytes cell subpopulation in spleen

Analysis of spleen leukocyte subpopulations by flow cytometry. Splenocytes were isolated from male B-NDG hIL15 mice and B-NDG hIL15, FcγR KO mice (n=3). Flow cytometry analysis of the leukocytes was performed to assess leukocyte subpopulations. A. Representative FACS plots. Single live cells were gated for the CD45+ population and used for further analysis as indicated here. B. Results of FACS analysis. Percent of granulocytes, monocytes, macrophages and DCs in homozygous B-NDG hIL15, FcγR KO mice were similar to those in the B-NDG hIL15 mice, demonstrating that knock out of FcγRs does not change the overall development, differentiation or distribution of these cell types in spleen. Values are expressed as mean ± SEM.
Antibody-binding assay using rituximab analog

Antibody-binding analysis of rituximab analog (in-house) in B-NDG mice, B-NDG hIL15 mice and B-NDG hIL15, FcγR KO mice by FACS. Blood were collected from B-NDG mice, B-NDG hIL15 mice and B-NDG hIL15, FcγR KO mice and analyzed by flow cytometry (male, 8-week-old, n=1). Results showed that rituximab analog (in-house) can bind to the CD45+ cells in B-NDG mice and B-NDG hIL15 mice, but can not bind to the cells in B-NDG hIL15, FcγR KO mice, indicating that the receptors of IgG antibody were not expressed on CD45+ cells of B-NDG hIL15, FcγR KO mice.
In vivo efficacy of anti-human CD20 antibody in CDX model established with huNK-B-NDG hIL15, FcγR KO mice

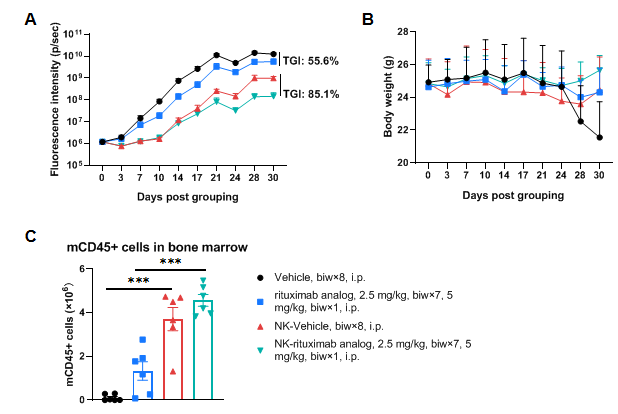
Antitumor activity of rituximab analog (in-house) in huNK-B-NDG hIL-15, FcγR KO mice. B-luc Daudi cells (5×10⁵) were intravenously injected into B-NDG hIL-15, FcyR KO mice. Tumor growth was observed by in vivo imaging systems (IVIS). After 3 days, mice were grouped when the fluorescence intensity reached approximately 1.2×10⁶ p/sec, at which time human NK cells expanded in vitro (5×10⁶) were engrafted into the mice and the mice were treated with anti-human CD20 antibody rituximab analog (in-house) twice a week for 4 weeks. Bone marrow was collected at the endpoint and the mouse CD45+ leukocytes were analyzed by flow cytometry. (A) Fluorescence intensity of the tumor cells; (B) Body weight; (C) The absolute number of mouse CD45+ cells in bone marrow. The results showed that the reconstituted human NK cells in B-NDG hIL-15, FcγR KO mice can inhibit the tumor growth. However, the combination of reconstituted human NK cells and rituximab analog in B-NDG hIL-15, FcγR KO mice can further inhibit tumor growth. Values are expressed as mean ± SEM. Significance was determined by one-way ANOVA test. *P < 0.05, **P < 0.01, ***P < 0.001.
The overage of this tumor model is 100%.
Engraftment level of human immune cells and tumor cells in huNK-B-NDG hIL15, FcγR KO mice

Human NK cells were successfully reconstituted in B-NDG hIL-15, FcγR KO mice. Peripheral blood were harvested on Day 21 and DAY 30 (n=6). Engraftment level of human immune cells and hCD20+ tumor cells in the NK cell engrafted groups (G3 & G4) were analyzed by flow cytometry. The frequency of human NK cells reached to more than 60% on Day 21. The frequency and absolute number of human NK cells decreased significantly on Day 30. On Day 30, the frequency and absolute number of human CD20+ tumor cells in the untreated group (G3) were significantly higher than those in the treated group (G4). Values are expressed as mean ± SEM.
Histopathological analysis of mice kidneys

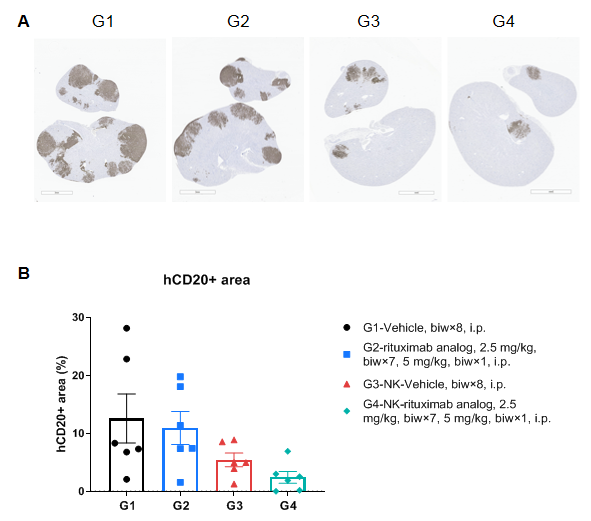
Immunohistochemical staining of human CD20+ Daudi cells in kidney. The kidneys were isolated at the endpoint. Human CD20+ Daudi cells were detected with anti-hCD20 antibody (abcam, ab78237) by immunohistochemistry. (A) Representative images; (B) Percentages of hCD20+ area in kidneys. Results showed that the reconstituted human NK cells in B-NDG hIL-15, FcγR KO mice can inhibit the tumor growth. However, the combination of reconstituted human NK cells and rituximab analog can further inhibit tumor growth. Values are expressed as mean ± SEM. Significance was determined by one-way ANOVA test. *P < 0.05, **P < 0.01, ***P < 0.001.


 京公网安备: