Description
- Background: Zmpste24 is a key enzyme involved in the post-translational processing of prelamin A, a precursor protein of lamin A. It functions to cleave the farnesylated CaaX motif from prelamin A, allowing proper maturation and nuclear localization of lamin A. In Zmpste24 knockout (KO) models, prelamin A accumulates in its unprocessed form, leading to nuclear envelope abnormalities and cellular dysfunction. This is closely related to progeroid syndromes, which are characterized by premature aging symptoms. The disruption of normal lamin A processing due to Zmpste24 deficiency impairs cellular integrity and function, resulting in phenotypes similar to those seen in human premature aging disorders, making it an important target for understanding the molecular mechanisms underlying progeria and potentially developing therapeutic strategies.
- Targeting strategy: The exons 3~10 of mouse Zmpste24 gene were knocked out in B-Zmpste24 KO mice.
- Validation: Mouse Zmpste24 mRNA was only detectable in wild-type C57BL/6JNifdc mice, but not in B-Zmpste24 KO mice. Body size of homozygous B-Zmpste24 KO mice was smaller than wild-type C57BL/6JNifdc mice. The lengths of the femur and tibia were shortened in homozygous B-Zmpste24 KO mice. Micro-CT analysis of bone microarchitecture showed a deterioration or loss of trabecular bone structure, which is consistent with characteristics of osteoporosis.
- Application: B-Zmpste24 KO mice can be used as a model to study the pathogenesis of progeroid syndromes, particularly Hutchinson-Gilford progeria syndrome (HGPS). It’s valuable for investigating the molecular mechanisms underlying premature aging, understanding the role of ZMPSTE24 in lamin A/C processing and nuclear envelope maintenance, and testing potential therapeutic interventions for progeroid syndromes
Targeting strategy
Gene targeting strategy for B-Zmpste24 KO mice. The exons 3~10 of mouse Zmpste24 gene were knocked out in B-Zmpste24 KO mice.
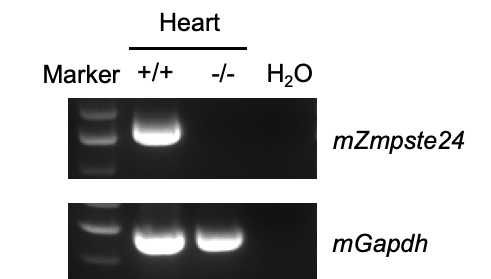
mRNA expression analysis
Strain specific analysis of Zmpste24 mRNA expression in wild-type C57BL/6JNifdc mice and B-Zmpste24 KO mice by RT-PCR. Heart RNA was isolated from wild-type C57BL/6JNifdc mice (+/+) and homozygous B-Zmpste24 KO mice (-/-). Mouse Zmpste24 mRNA was only detectable in wild-type C57BL/6JNifdc mice, but not in B-Zmpste24 KO mice.
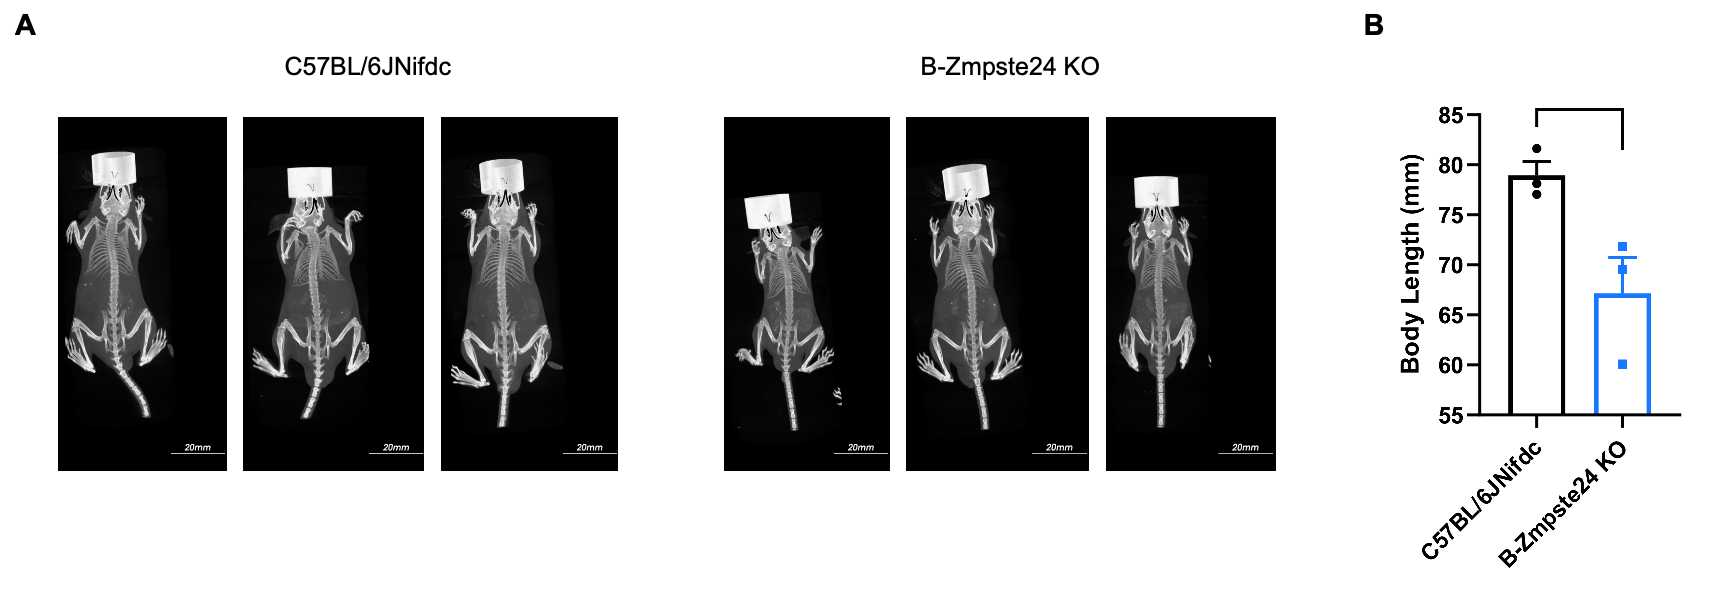
Micro-CT imaging of whole body
Whole-body micro-CT imaging of homozygous B-Zmpste24 KO mice. (A) Representative whole-body micro-CT images of mice wild-type C57BL/6JNifdc mice (n=3, male, 6-week-old) and homozygous B-Zmpste24 KO mice (n=3, male, 6-week-old). (B) Quantitative comparison of body length (from oral-nasal region to tail tip). Body size of homozygous B-Zmpste24 KO mice was smaller than wild-type C57BL/6JNifdc mice. Data are presented as mean ± SEM. *P < 0.05, **P < 0.01, ***P < 0.001. Scale bar = 20 mm.
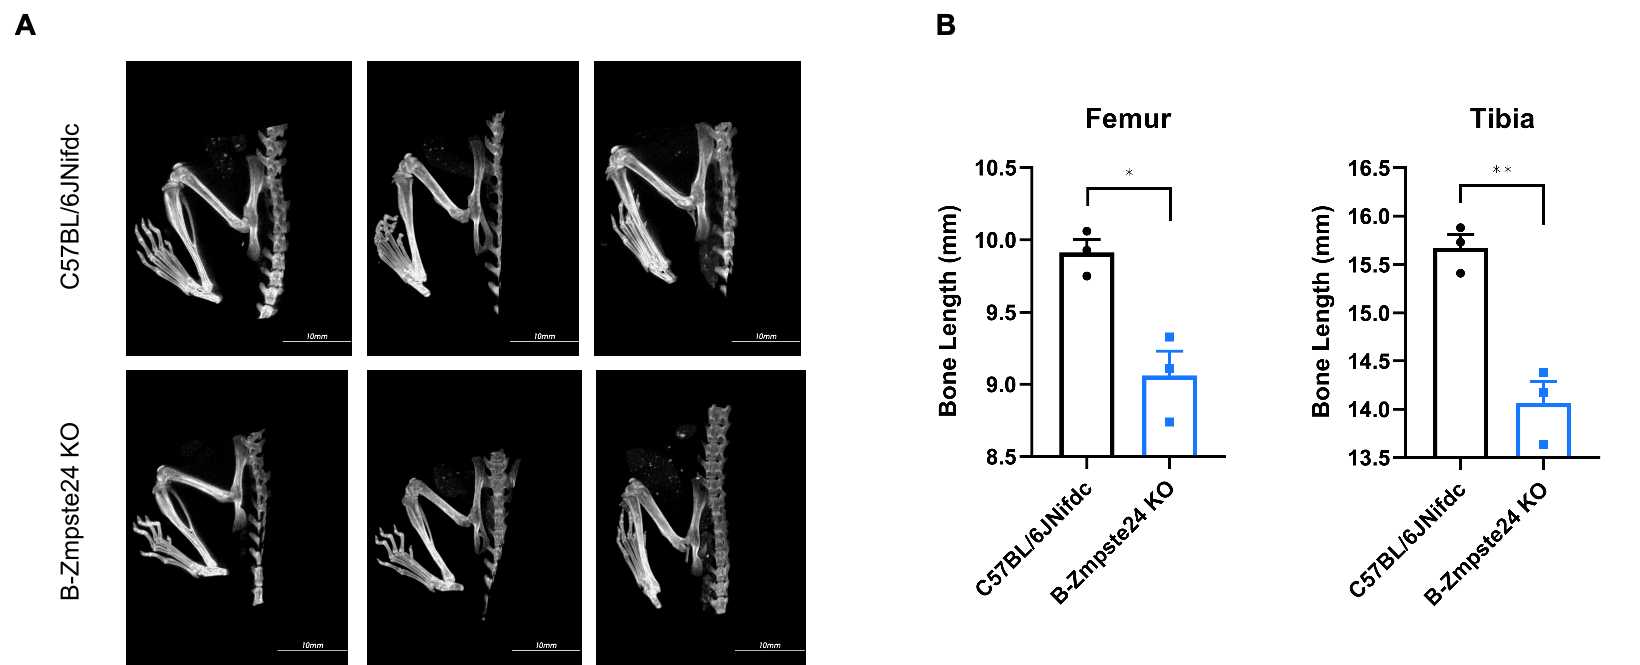
Micro-CT analysis of femur and tibia length
Micro-CT analysis of femur and tibia length in homozygous B-Zmpste24 KO mice. (A) Representative micro-CT images of femur and tibia from wild-type C57BL/6JNifdc mice (n=3, male, 6-week-old) and homozygous B-Zmpste24 KO mice (n=3, male, 6-week-old). (B) Quantitative comparison of femur and tibia length. In the homozygous B-Zmpste24 KO mice, the lengths of the femur and tibia were shortened. Data are presented as mean ± SEM. *P < 0.05, **P < 0.01, ***P < 0.001. Scale bar = 10 mm.
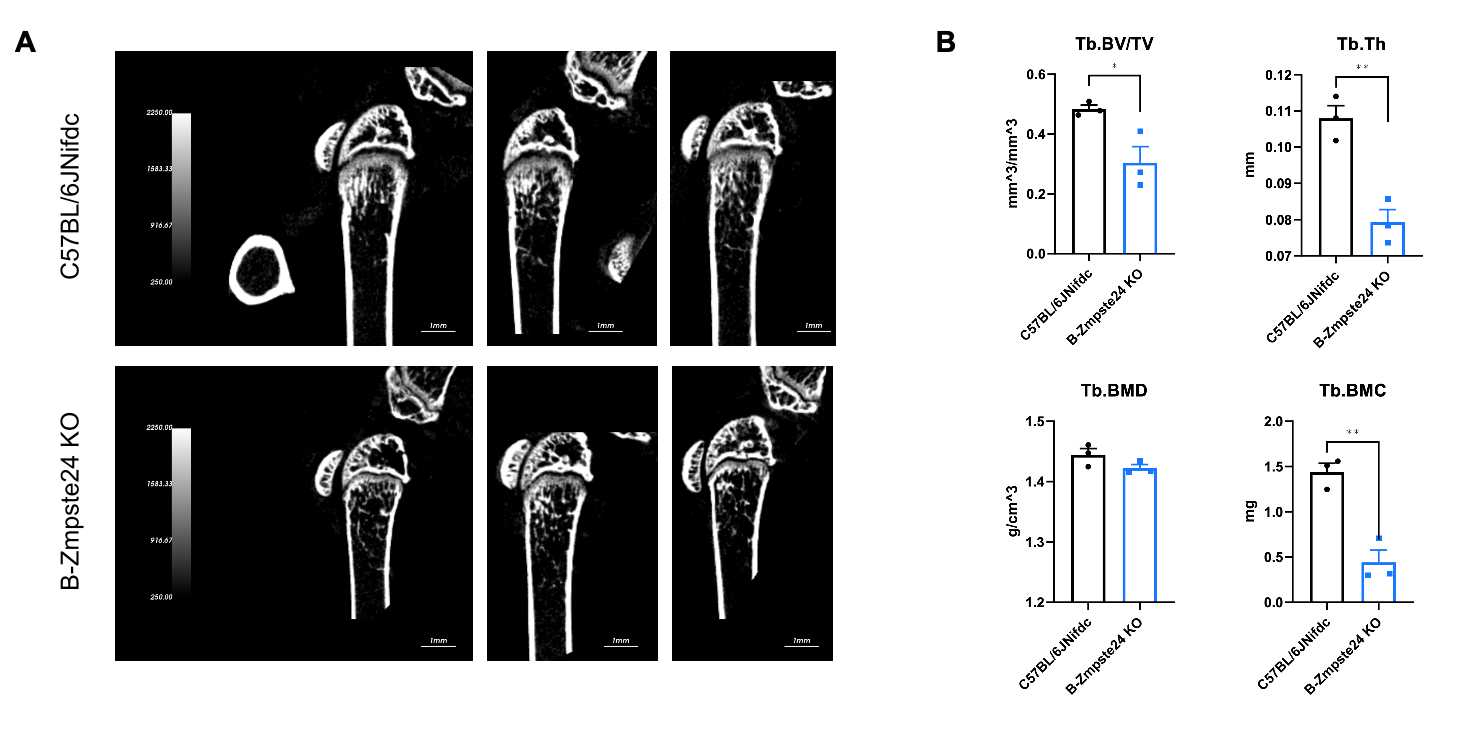
Micro-CT analysis of bone microarchitecture
Micro-CT analysis of bone microarchitecture in homozygous B-Zmpste24 KO mice. (A) Representative micro-CT images of trabecular bone from wild-type C57BL/6JNifdc mice (n=3, male, 6-week-old) and homozygous B-Zmpste24 KO mice (n=3, male, 6-week-old). (B) Quantitative analysis of bone volume fraction (Tb.BV/TV), trabecular thickness (Tb.Th), trabecular bone mineral density (Tb.BMD) and trabecular bone mineral content (Tb.BMC). Tb.BV/TV, Tb.Th, Tb.BMC decreased in homozygous B-Zmpste24 KO mice compared with wild-type mice, indicating a deterioration or loss of trabecular bone structure, which is consistent with characteristics of osteoporosis. Data are presented as mean ± SEM. *P < 0.05, **P < 0.01, ***P < 0.001.
* When publishing results obtained using this animal model, please acknowledge the source as follows: The animal model [B-Zmpste24 KO mice] (Cat# 113378) was purchased from Biocytogen.