
C57BL/6JNifdc-B2mtm1(B2M/HLA-A11.1/H2-D)Bcgen/Bcgen • 112803
在此页面上
Beta-2 microglobulin (B2M) encodes a serum protein that associates with major histocompatibility complex (MHC) class I heavy chains on the surface of nearly all nucleated cells. Structurally, B2M exhibits a predominantly β-pleated sheet conformation and can form amyloid fibrils under certain pathological conditions. HLA-A is a member of the human MHC class I heavy chain paralogues and is anchored in the cell membrane. MHC class I molecules play a fundamental role in adaptive immunity by presenting intracellularly derived peptides to cytotoxic T cells and are ubiquitously expressed in most cell types.
In HLA-A11.1 humanized mice (B-HLA-A11.1), exons 1–3 of the mouse B2m gene were replaced with a genetic construct containing the human B2M coding sequence (CDS), together with the leader sequence and α1/α2 domains of the human HLA-A*1101 allele, ligated to a fragment of the murine H-2Dᵇ gene encoding the α3 domain, transmembrane region, and cytoplasmic tail.
Validation data confirm species-specific expression of human B2M and HLA-A*1101 exclusively in homozygous HLA-A11.1 humanized mice (B-HLA-A11.1).
Key Advantages
Validation
Application: This model is well suited for pharmacodynamic and safety assessment of cancer vaccines, as well as for studying HLA-A11.1–restricted immune responses during vaccine development.
In HLA-A11.1 humanized mice (B-HLA-A11.1), exons 1–3 of the mouse B2m gene, which encode β2-microglobulin essential for MHC class I surface expression, were replaced with a sequence comprising the human B2M coding sequence together with the HLA-A*1101 gene. The HLA-A*1101 construct includes the leader sequence and the α1 and α2 domains of human HLA-A*1101, which are fused to a fragment of the murine H-2Dᵇ gene encoding the α3 domain, transmembrane region, and cytoplasmic tail. This design enables stable expression of functional human HLA-A11.1 molecules within a murine physiological context while disrupting endogenous mouse B2m expression.
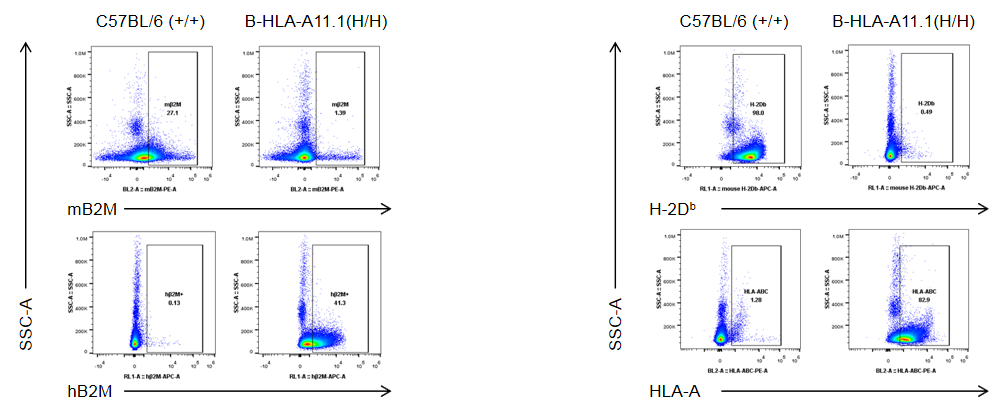
Strain-specific B2M and HLA-A expression in homozygous HLA-A11.1 humanized mice (B-HLA-A11.1, H/H) was assessed by flow cytometry. Splenocytes were isolated from wild-type C57BL/6 mice (+/+) and homozygous HLA-A11.1 humanized mice (H/H) and analyzed by flow cytometry using species-specific anti-B2M and anti–HLA-A antibodies. Murine B2M and H-2Dᵇ proteins were detected in wild-type controls, whereas human B2M and HLA-A11.1 were exclusively expressed in homozygous HLA-A11.1 humanized mice (B-HLA-A11.1) and were absent in wild-type mice.

Flow cytometric analysis of spleen leukocyte subpopulations. Splenocytes were isolated from female C57BL/6 and homozygous HLA-A11.1 humanized mice (n = 3, 8 weeks old) and analyzed by FACS. (A) Representative FACS plots. Single live cells were gated for the CD45+ population for downstream analysis. (B) Quantification of leukocyte subsets, including T cells, B cells, NK cells, dendritic cells, granulocytes, monocytes, and macrophages. Most populations were comparable between strains; however, CD8⁺ T cells were significantly reduced in B-HLA-A11.1 mice, indicating that replacement of mouse B2m with the hB2M–HLA-A11.1–H-2D construct affects CD8⁺ T-cell development and alters splenic T-cell composition. Data are presented as mean ± SEM.
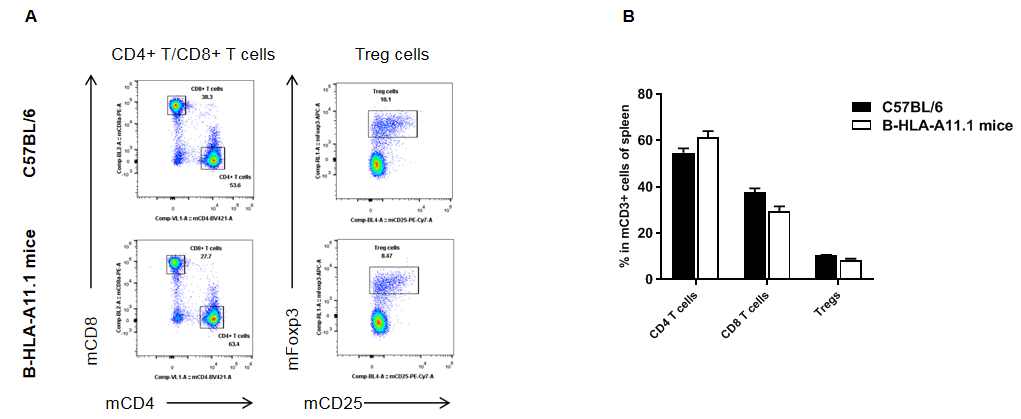
Analysis of spleen T cell subpopulations in HLA-A11.1 humanized mice (B-HLA-A11.1) by flow cytometry. Splenocytes were isolated from female wild-type C57BL/6 mice and HLA-A11.1 humanized mice (B-HLA-A11.1) (n = 3, 8 weeks old) and analyzed by flow cytometry to assess T cell subpopulations. (A) Representative FACS plots. Single live CD45⁺ cells were gated for TCRβ⁺ T cells. (B) Quantitative analysis of T cell subsets. The percentage of regulatory T cells (Tregs) in homozygous HLA-A11.1 humanized mice (B-HLA-A11.1) was comparable to that observed in C57BL/6 mice. In contrast, the proportion of CD8⁺ T cells was significantly decreased, while the proportion of CD4⁺ T cells was significantly increased in HLA-A11.1 humanized mice (B-HLA-A11.1). These results indicate that replacement of mouse B2M with the hB2M–HLA-A11.1–H-2D construct affects CD8⁺ T cell development, thereby altering the distribution of T cell subtypes in the spleen. Data are presented as mean ± SEM.
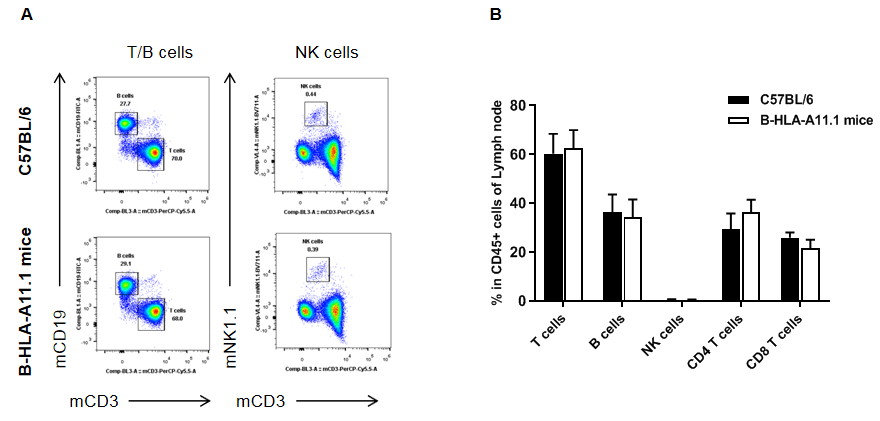
Analysis of lymph node leukocyte subpopulations in HLA-A11.1 humanized mice (B-HLA-A11.1) by flow cytometry. Lymph nodes were isolated from female wild-type C57BL/6 mice and HLA-A11.1 humanized mice (B-HLA-A11.1) (n = 3, 8 weeks old) and analyzed by flow cytometry to assess leukocyte subpopulations in the lymph nodes. (A) Representative FACS plots. Single live CD45⁺ cells were gated and used for downstream analysis as indicated. (B) Quantitative analysis of leukocyte subsets. The percentages of total T cells, B cells, and NK cells in homozygous HLA-A11.1 humanized mice (B-HLA-A11.1) were comparable to those observed in C57BL/6 mice. In contrast, the proportion of CD8⁺ T cells was significantly decreased, indicating that replacement of mouse B2M with the hB2M–HLA-A11.1–H-2D construct affects CD8⁺ T cell development and consequently alters the distribution of T cell subtypes in the lymph nodes. Data are presented as mean ± SEM.
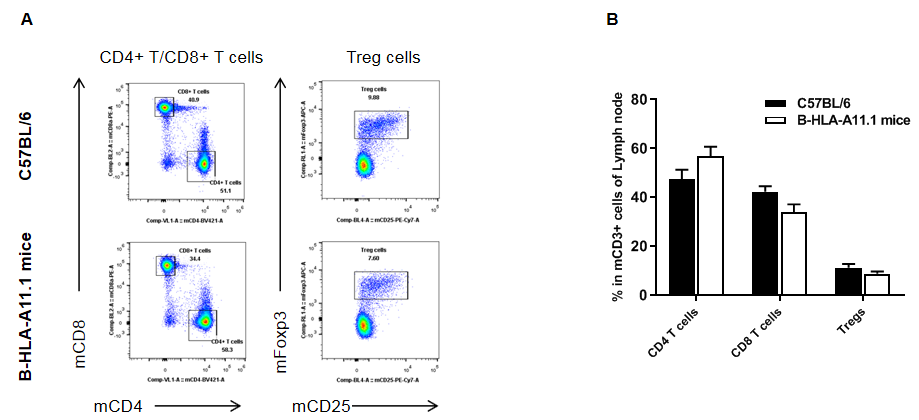
Analysis of lymph node T cell subpopulations in HLA-A11.1 humanized mice (B-HLA-A11.1) by flow cytometry. Lymph nodes were isolated from female wild-type C57BL/6 mice and HLA-A11.1 humanized mice (B-HLA-A11.1) (n = 3, 8 weeks old) and analyzed by flow cytometry to assess T cell subpopulations in the lymph nodes. (A) Representative FACS plots. Single live CD45⁺ cells were gated for TCRβ⁺ T cells. (B) Quantitative analysis of T cell subsets. The percentage of Tregs in homozygous HLA-A11.1 humanized mice (B-HLA-A11.1) was comparable to that observed in C57BL/6 mice. In contrast, the proportion of CD8⁺ T cells was significantly decreased, while the proportion of CD4⁺ T cells was significantly increased, indicating that replacement of mouse B2M with the hB2M–HLA-A11.1–H-2D construct affects CD8⁺ T cell development and consequently alters the distribution of T cell subtypes in the lymph nodes. Data are presented as mean ± SEM.

Analysis of blood leukocyte subpopulations in HLA-A11.1 humanized mice (B-HLA-A11.1) by flow cytometry. Blood cells were isolated from female wild-type C57BL/6 mice and HLA-A11.1 humanized mice (B-HLA-A11.1) (n = 3, 8 weeks old) and analyzed by flow cytometry to assess leukocyte subpopulations in peripheral blood. (A) Representative FACS plots. Single live CD45⁺ cells were gated and used for downstream analysis. (B) Quantitative analysis of leukocyte subsets. The percentages of total T cells, B cells, NK cells, dendritic cells, granulocytes, monocytes, and macrophages in homozygous HLA-A11.1 humanized mice (B-HLA-A11.1) were comparable to those observed in C57BL/6 mice. In contrast, the proportion of CD8⁺ T cells was significantly decreased, indicating that replacement of mouse B2M with the hB2M–HLA-A11.1–H-2D construct affects CD8⁺ T cell development and consequently alters the distribution of T cell subtypes in peripheral blood. Data are presented as mean ± SEM.
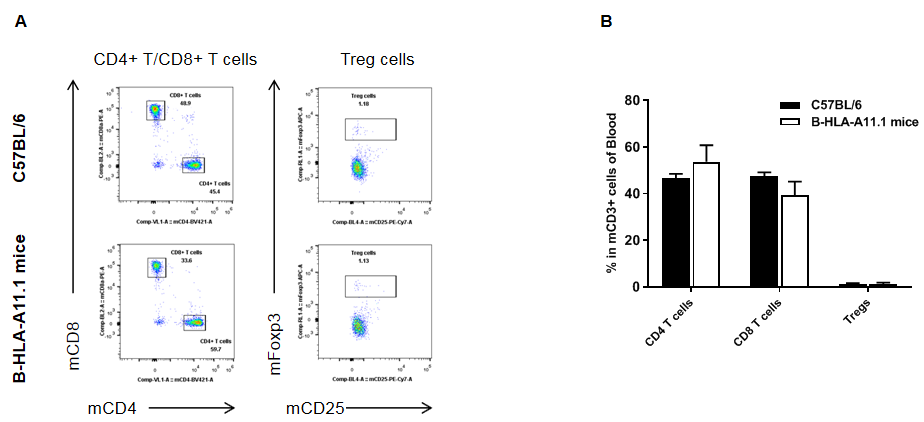
Analysis of blood T cell subpopulations in HLA-A11.1 humanized mice (B-HLA-A11.1) by flow cytometry. Blood cells were isolated from female wild-type C57BL/6 mice and HLA-A11.1 humanized mice (B-HLA-A11.1) (n = 3, 8 weeks old) and analyzed by flow cytometry to assess leukocyte subpopulations. (A) Representative FACS plots. Single live CD45⁺ cells were gated for TCRβ⁺ T cells, including CD4⁺ T cells, CD8⁺ T cells, and regulatory T cells (Tregs). (B) Quantitative analysis of T cell subsets. The percentage of Tregs in homozygous HLA-A11.1 humanized mice (B-HLA-A11.1) was comparable to that observed in C57BL/6 mice. In contrast, the proportion of CD8⁺ T cells was significantly decreased, while the proportion of CD4⁺ T cells was significantly increased, indicating that replacement of mouse B2M with the hB2M–HLA-A11.1–H-2D construct affects CD8⁺ T cell development and consequently alters the distribution of T cell subtypes in peripheral blood. Data are presented as mean ± SEM.
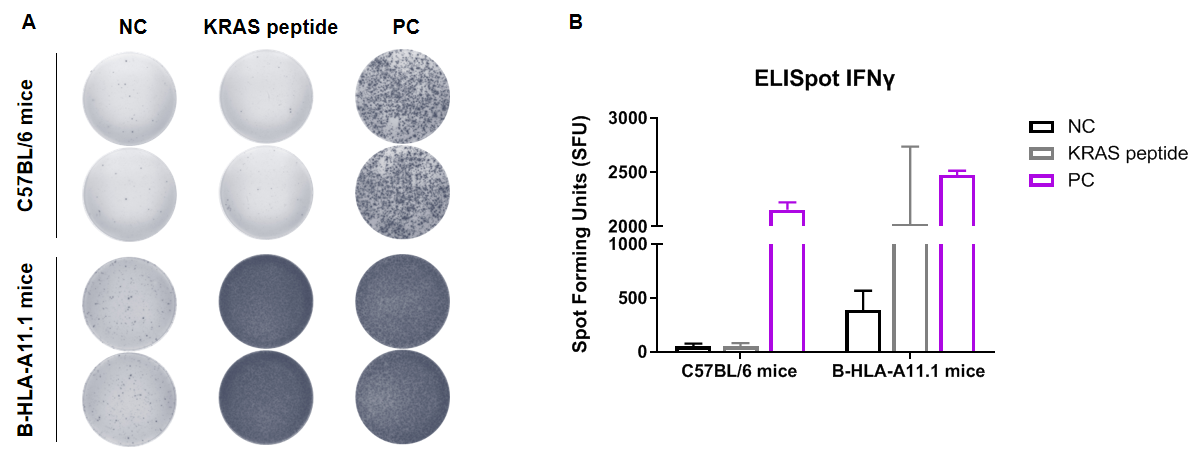
Detection of peptide vaccine–induced immune responses in HLA-A11.1 humanized mice (B-HLA-A11.1) by IFN-γ ELISpot assay. Female wild-type C57BL/6 mice and HLA-A11.1 humanized mice (B-HLA-A11.1) (n = 2, 7–8 weeks old) were divided into PBS control and KRAS peptide vaccine groups and immunized by intramuscular injection in both hind legs. Three weeks after the final immunization, mice were sacrificed and splenocytes were isolated. Cells were stimulated with individual peptides, target-unrelated polypeptides as negative control (NC), or anti-CD3 as positive control (PC), and IFN-γ secretion was measured by ELISpot assay. No significant differences in body weight were observed among groups (data not shown). (A) Representative ELISpot images showing responses of splenocytes from immunized mice stimulated with NC, KRAS peptide, or PC in duplicate. (B) Summary of ELISpot results expressed as spot-forming units (SFU). These data demonstrate that HLA-A11.1 humanized mice (B-HLA-A11.1) provide a powerful preclinical model for in vivo evaluation of peptide vaccines. Data are presented as mean ± SEM. NC, negative control; PC, positive control.
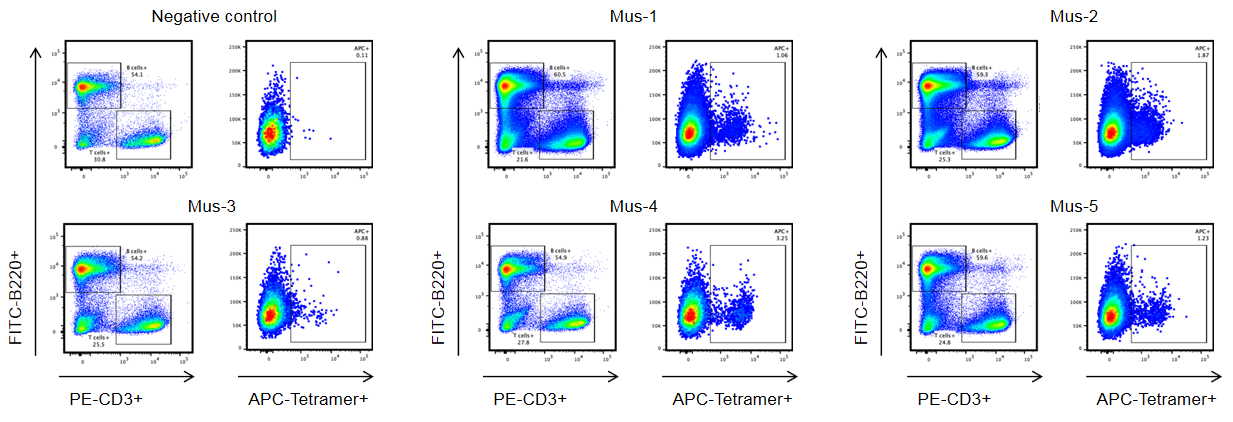
Identification of target peptide–specific TCRs in HLA-A11.1 humanized mice (B-HLA-A11.1) by flow cytometry. HLA-A11.1 humanized mice (B-HLA-A11.1) were subcutaneously immunized with the target peptide, and spleen cells from five mice (Mus-1, Mus-2, Mus-3, Mus-4, and Mus-5) that exhibited target peptide–specific immune responses were collected for analysis. Spleen cells were stained with target peptide/HLA-A*1101 tetramers, and tetramer-positive CD8⁺ T cells were identified and isolated by single-cell sorting using flow cytometry. A mouse without target peptide immunization was included as the negative control. These results demonstrate that HLA-A11.1 humanized mice (B-HLA-A11.1) can be used for identifying target peptide–specific TCRs and for investigating mechanisms of peptide presentation and TCR recognition of cancer target epitopes in the context of HLA-A1101. (All results were provided by the client).
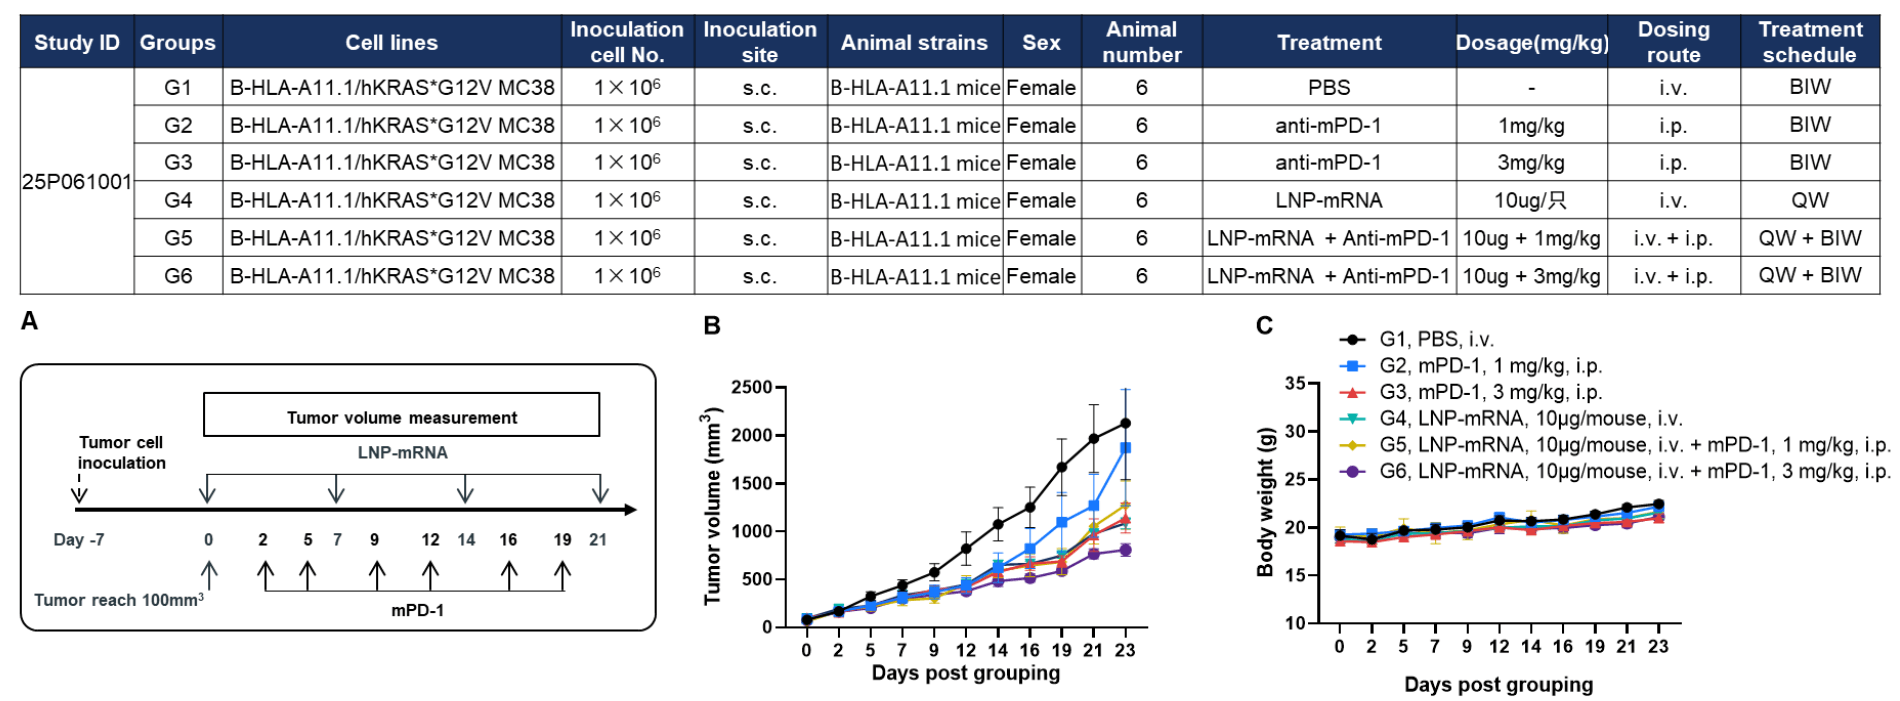
Antitumor activity of anti–mouse PD-1 antibody combined with KRAS*G12V mRNA vaccine in HLA-A11.1 humanized mice (B-HLA-A11.1). HLA-A11.1 humanized mice (B-HLA-A11.1) were subcutaneously implanted with 1 × 10⁶ B-HLA-A11.1/hKRAS*G12V MC38 tumor cells in the right flank and grouped when tumor volume reached approximately 100 mm³. Mice were then treated with anti–mouse PD-1 antibody or therapeutic mRNA vaccine according to the doses and schedules indicated. (A) Experimental scheme illustrating tumor inoculation, mRNA vaccination, and anti–mouse PD-1 antibody treatment schedule. (B) Tumor growth curves showing that the combination of anti–mouse PD-1 antibody and mRNA vaccine exhibited greater inhibitory effects on tumor growth than either treatment alone. (C) Body weight changes during tumor growth observation. These results demonstrate that HLA-A11.1 humanized mice (B-HLA-A11.1) provide a powerful preclinical model for in vivo evaluation of combination therapy efficacy of mPD-1 antibodies and mRNA vaccines. Values are expressed as mean ± SEM.
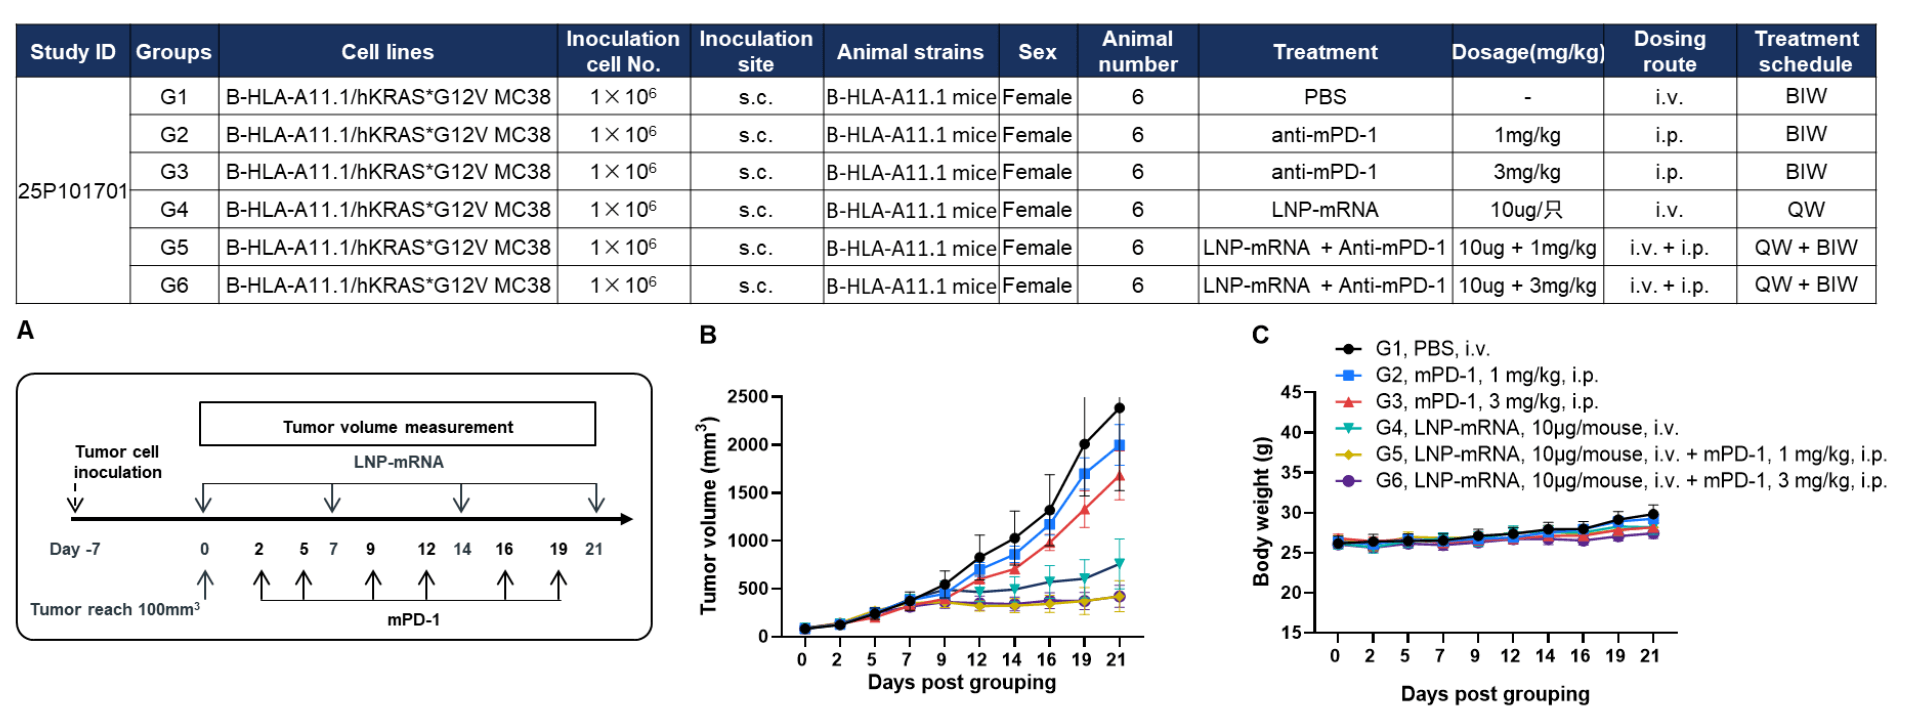
Antitumor activity of anti–mouse PD-1 antibody combined with KRAS*G12V mRNA vaccine in HLA-A11.1 humanized mice (B-HLA-A11.1). HLA-A11.1 humanized mice (B-HLA-A11.1) were subcutaneously implanted with 1 × 10⁶ B-HLA-A11.1/hKRAS*G12V MC38 tumor cells in the right flank and grouped when tumor volume reached approximately 100 mm³, at which time mice were treated with anti–mouse PD-1 antibody or therapeutic mRNA vaccine according to the doses and schedules indicated. (A) Experimental scheme illustrating tumor cell inoculation, LNP-mRNA administration, tumor volume measurement, and anti–mouse PD-1 antibody treatment. (B) Tumor growth curves showing that the combination of anti–mouse PD-1 antibody and mRNA vaccine exhibited greater inhibitory effects on tumor growth compared with individual treatment groups. (C) Body weight changes during tumor growth observation. These results demonstrate that HLA-A11.1 humanized mice (B-HLA-A11.1) provide a powerful preclinical model for in vivo evaluation of combination therapy efficacy of mPD-1 antibodies and mRNA vaccines. Values are expressed as mean ± SEM.
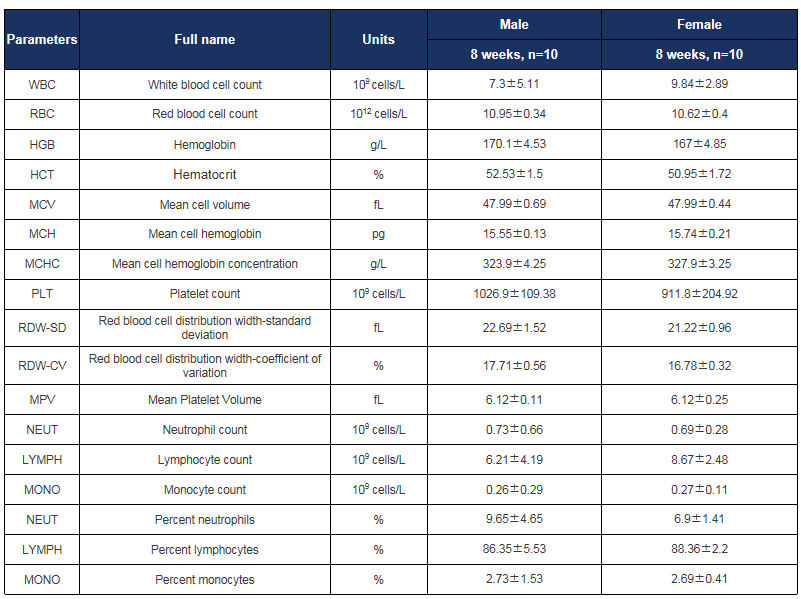
Hematology analysis in HLA-A11.1 humanized mice (B-HLA-A11.1). Complete blood count (CBC) parameters were assessed in male and female HLA-A11.1 humanized mice (B-HLA-A11.1) at 8 weeks of age (n = 10 per sex). All values are expressed as mean ± SD.
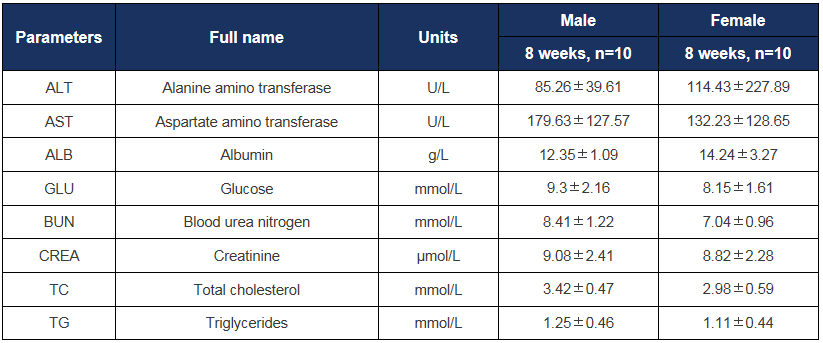
Biochemistry analysis in HLA-A11.1 humanized mice (B-HLA-A11.1). Serum biochemical parameters were assessed in male and female HLA-A11.1 humanized mice (B-HLA-A11.1) at 8 weeks of age (n = 10 per sex). All values are expressed as mean ± SD.

Gross anatomy of female HLA-A11.1 humanized mice (B-HLA-A11.1). Major organs were collected from female HLA-A11.1 humanized mice (B-HLA-A11.1) at 8 weeks of age (n = 10). Representative images show the gross morphology of the spleen, lung, brain, kidney, ovary, heart, liver, uterus, stomach, small intestine, and colon.

Gross anatomy of male HLA-A11.1 humanized mice (B-HLA-A11.1). Major organs were collected from male HLA-A11.1 humanized mice (B-HLA-A11.1) at 8 weeks of age (n = 10). Representative images show the gross morphology of the spleen, lung, brain, kidney, testis, heart, liver, stomach, small intestine, and colon.
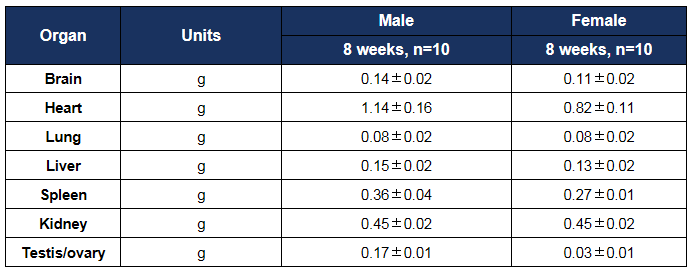
Organ weight analysis in HLA-A11.1 humanized mice (B-HLA-A11.1). The average weights of major organs were measured in male and female HLA-A11.1 humanized mice (B-HLA-A11.1) at 8 weeks of age (n = 10 per sex). All values are expressed as mean ± SD.
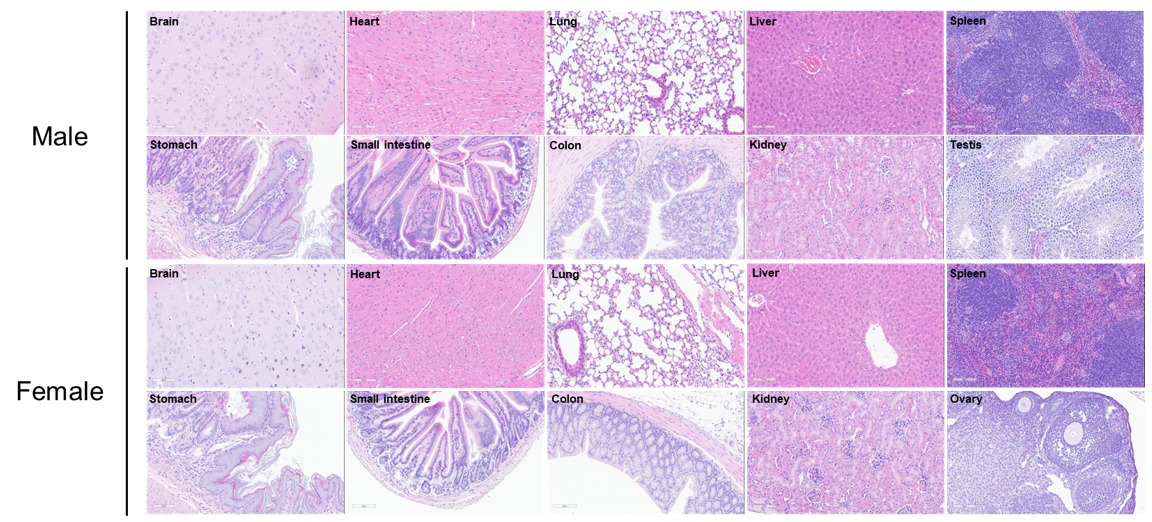
Histopathological analysis in HLA-A11.1 humanized mice (B-HLA-A11.1). Major organs were collected from male and female HLA-A11.1 humanized mice (B-HLA-A11.1) at 8 weeks of age (male, n = 10; female, n = 10) and subjected to hematoxylin and eosin (H&E) staining for histopathological evaluation. Representative sections of the brain, heart, lung, liver, spleen, stomach, small intestine, colon, kidney, ovary, and testis are shown. Histological examination revealed no obvious abnormalities in any of the organs analyzed. Scale bar: 100 μm.
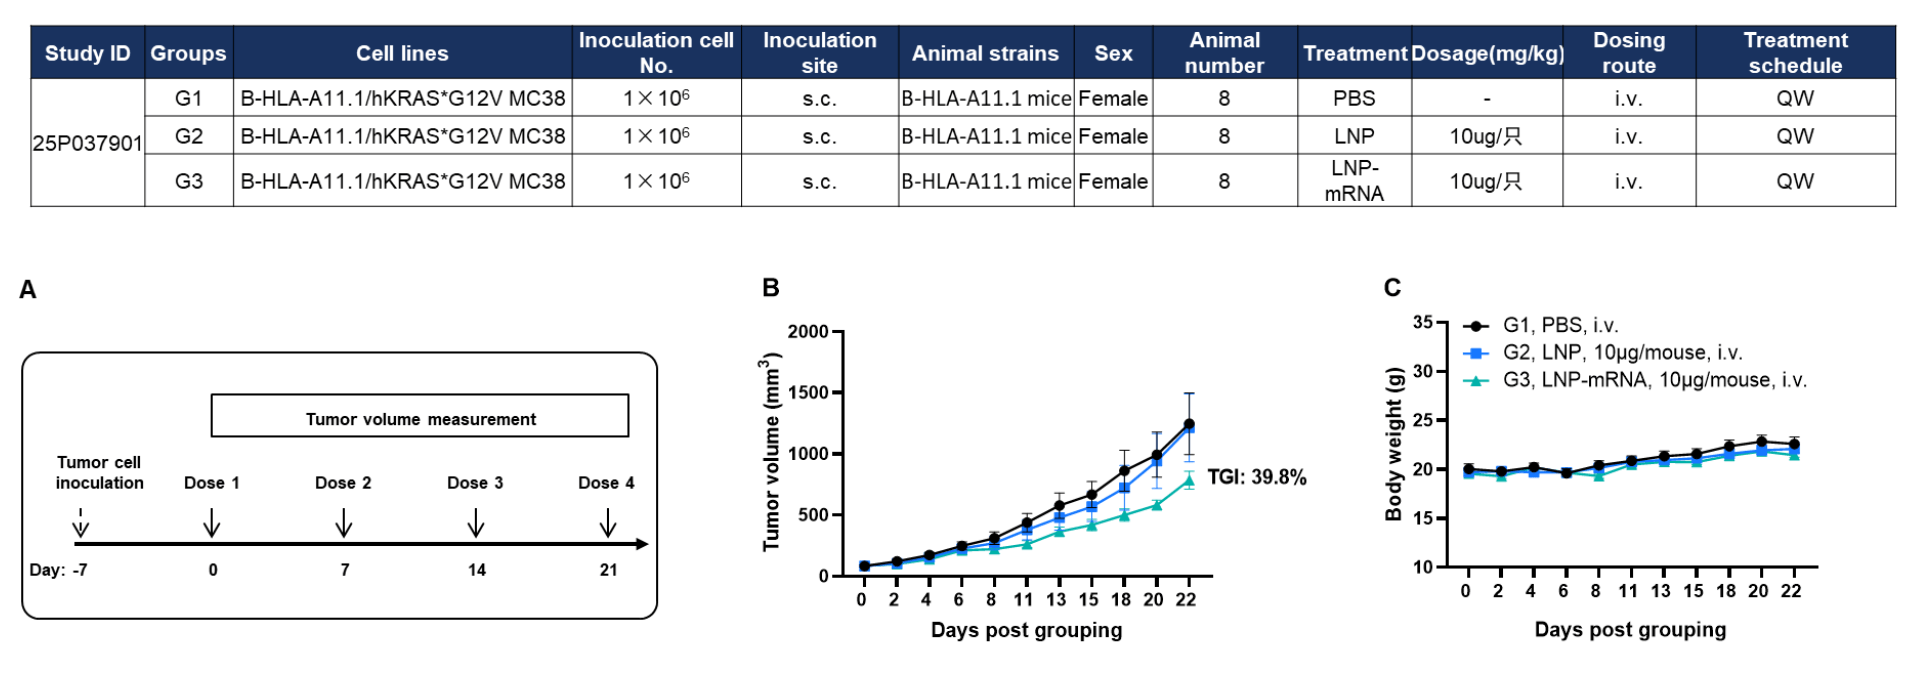
Antitumor activity of KRAS*G12V mRNA vaccine in HLA-A11.1 humanized mice (B-HLA-A11.1). HLA-A11.1 humanized mice (B-HLA-A11.1) were subcutaneously implanted with 1 × 10⁶ B-HLA-A11.1/hKRAS*G12V MC38 tumor cells in the right flank and grouped when tumor volume reached approximately 100 mm³. Mice were then immunized with PBS, LNP, or LNP-formulated mRNA vaccine according to the dosing schedule indicated. (A) Experimental scheme illustrating tumor cell inoculation, mRNA vaccination schedule, and tumor volume measurement. (B) Tumor growth curves showing that therapeutic treatment with the KRAS*G12V mRNA vaccine inhibited tumor growth compared with control groups. (C) Body weight changes during tumor growth observation. These results demonstrate that HLA-A11.1 humanized mice (B-HLA-A11.1) provide a robust preclinical model for in vivo evaluation of mRNA vaccines. Values are expressed as mean ± SEM.
Q1: What are B-HLA-A11.1 mice?
B-HLA-A11.1 mice are a humanized preclinical model. In this model, the mouse B2m gene (exons 1-3) is replaced by a chimeric construct containing the human B2M coding sequence and the α1-α2 domains of the human HLA-A*1101 allele, which are fused to the α3, transmembrane, and cytoplasmic domains of the murine H-2D gene. This enables the expression of the complete human B2M/HLA-A11.1 protein complex on the cell surface, replacing the endogenous mouse MHC I complex.
Q2: Why is the HLA-A11.1 humanized mouse model important for immunotherapy and vaccine research?
The HLA-A*1101 allele is one of the most prevalent HLA class I alleles in Asian populations. This model provides a critical in vivo platform to evaluate HLA-A11.1-restricted immune responses, and is essential for developing and testing personalized cancer vaccines, adoptive T cell therapies (like TCR-T), and other immunotherapies.
Q3: How was the human B2M and HLA-A*1101 gene knocked in?
The targeting strategy involved replacing exons 1-3 of the mouse B2m gene with a sequence containing the human B2M CDS followed by a chimeric gene: the leader sequence, α1, and α2 domains of human HLA-A*1101, linked to the α3, transmembrane, and cytoplasmic domains of the mouse H-2D gene. This design ensures proper folding, surface expression, and function of the humanized MHC I molecule in mouse cells.
Q4: Has the human HLA-A11.1 expression and function been validated in this model?
Yes. Human B2M and HLA-A11.1 protein expression is confirmed on immune cells (e.g., splenocytes) by species-specific flow cytometry. Functional validation is demonstrated through antigen presentation assays, in which immunization with HLA-A11.1–restricted peptides (e.g., a KRAS peptide) induces potent antigen-specific T cell responses.
Q5: What are the main applications of the B-HLA-A11.1 mouse model?
This model is primarily used for: