
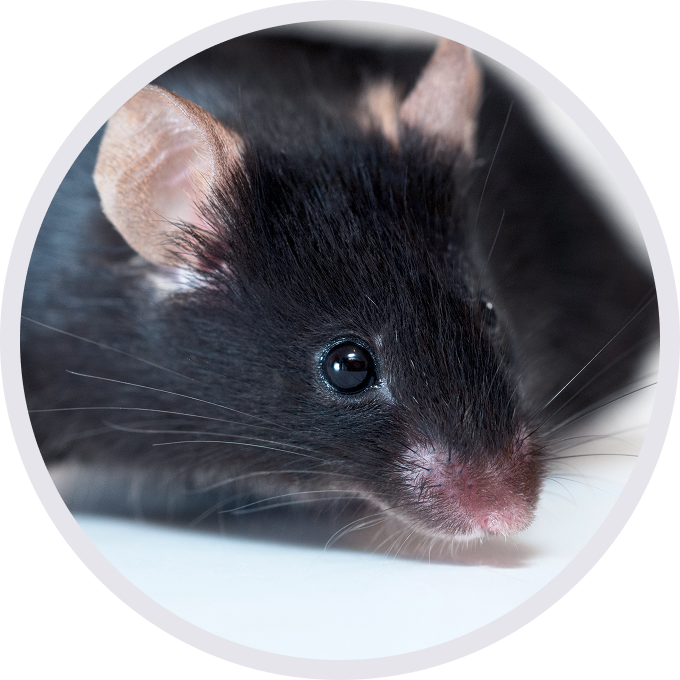
C57BL/6-Tfrctm1(TFRC)Bcgen Rag2tm1Bcgen/Bcgen • 112904

RAG2: An essential chromatin-sensing cofactor in V(D)J recombination
•Gene Information: Recombination Activating 2 (RAG2) is a protein-coding gene located on chromosome 11p12, which is involved in the initiation of V(D)J recombination during B and T cell development.
•Protein Expression: RAG2 exists exclusively in T and B cells at specific early developmental stages within the bone marrow and thymus. It is expressed and survives only during the G0/G1 phase, and the Rag2 protein is rapidly degraded as soon as the cell undergoes DNA replication.
•Signaling Pathway: RAG2 forms a DNA-cleaving complex with RAG1. In this complex, RAG1 provides the catalytic activity, RAG2 acts as a structural scaffold: its N-terminus binds tightly to DNA, and its C-terminal PHD finger anchors the complex to chromatin via trimethylated histone H3 (H3K4me3), which is the core component in the immune system that controls the assembly of diverse immune receptors.
•Therapeutic Inhibition: Complete deficiency of RAG2 leads to severe immunodeficiency characterized by a near-total absence of mature T and B cells, thereby precluding the development of autoimmunity. RAG2 mutations can cause Omenn syndrome, a severe combined immunodeficiency associated with autoimmune-like symptoms.

TFR1:
The exons 4-19 of mouse Tfr1 gene that encode extracellular domain are replaced by human counterparts in B-hTFR1/Rag2 KO mice.
The genomic region of mouse Tfr1 gene that encodes cytoplasmic portion is retained.
The promoter, 5’UTR and 3’UTR region of the mouse gene are also retained. The chimeric TFR1 expression is driven by endogenous mouse Tfr1 promoter, while mouse Tfr1 gene transcription and translation will be disrupted.
Rag2:
The exon 3 and 3’UTR region of mouse Rag2 were knocked out in B-hTFR1/Rag2 KO mice, resulting in a disruption of the Rag2 gene.

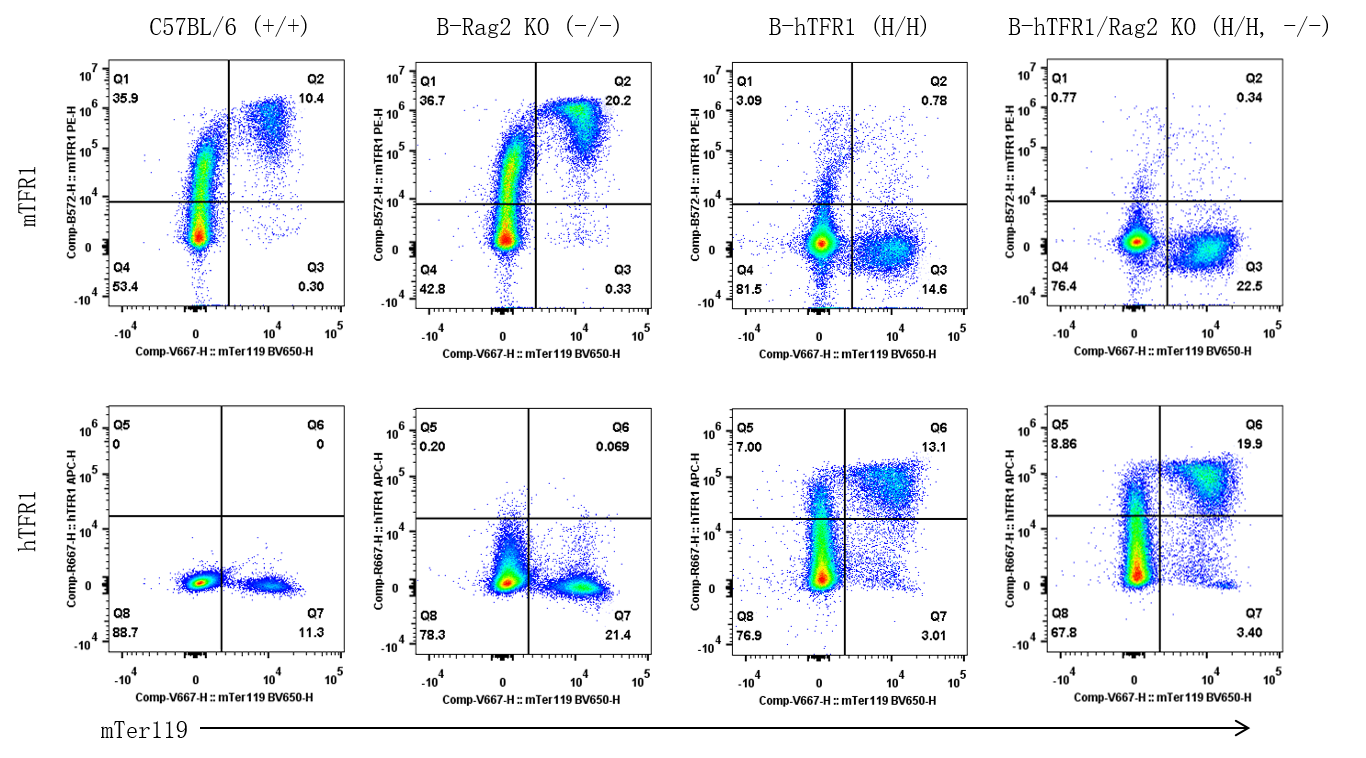
Strain specific TFR1 expression analysis in homozygous B-hTFR1, Rag2 KO mice by flow cytometry. Bone marrow were collected from wild-type C57BL/6 mice (+/+), homozygous B-Rag2 KO mice (-/-), homozygous B-hTFR1 mice (H/H) and homozygous B-hTFR1/Rag2 KO mice (H/H, -/-), and analyzed by flow cytometry with species-specific anti-mouse TFR1 antibody (BioLegend, 113807) and anti-human TFR1 antibody (BioLegend, 334107).
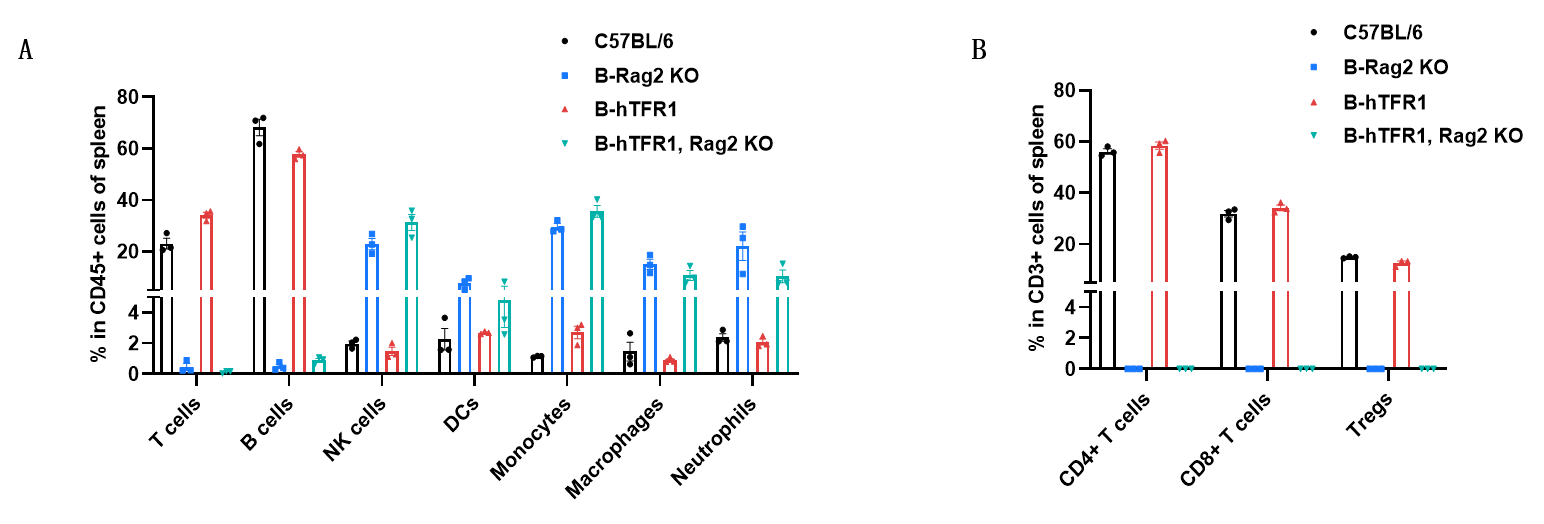
Frequency of leukocyte subpopulations in spleen by flow cytometry. Splenocytes were isolated from female wild-type C57BL/6 mice (n=3, 7-week-old), homozygous B-Rag2 KO mice (n=3, 6-week-old), homozygous B-hTFR1 mice (n=3, 9-week-old) and homozygous B-hTFR1/Rag2 KO mice (n=3, 10-week-old). A. Flow cytometry analysis of the splenocytes was performed to assess the frequency of leukocyte subpopulations. B. Frequency of T cell subpopulations. Percentages of T cells, B cells, NK cells, DCs, neutrophils, monocytes, macrophages, CD4+ T cells, CD8+ T cells and Tregs in B-hTFR1 mice were similar to those in C57BL/6 mice. Values are expressed as mean ± SEM.
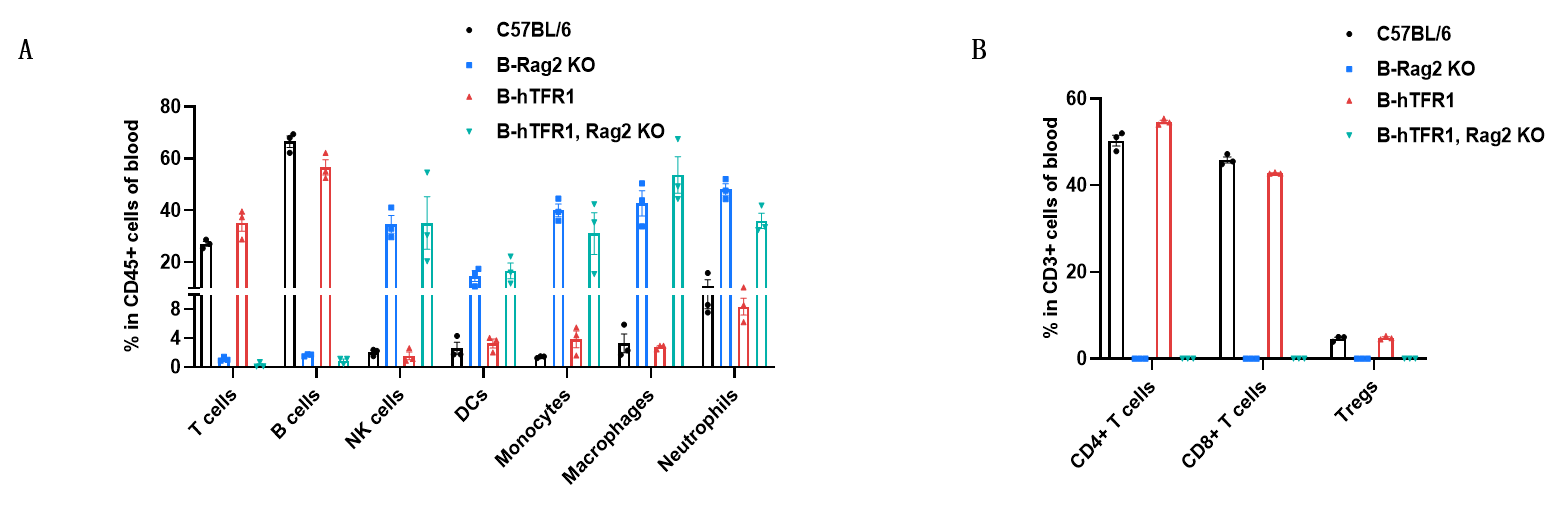
Frequency of leukocyte subpopulations in blood by flow cytometry. Blood cells were isolated from female wild-type C57BL/6 mice (n=3, 7-week-old), homozygous B-Rag2 KO mice (n=3, 6-week-old), homozygous B-hTFR1 mice (n=3, 9-week-old) and homozygous B-hTFR1/Rag2 KO mice (n=3, 10-week-old). A. Flow cytometry analysis of the splenocytes was performed to assess the frequency of leukocyte subpopulations. B. Frequency of T cell subpopulations. Percentages of T cells, B cells, NK cells, DCs, neutrophils, monocytes, macrophages, CD4+ T cells, CD8+ T cells and Tregs in B-hTFR1 mice were similar to those in C57BL/6 mice. Values are expressed as mean ± SEM.
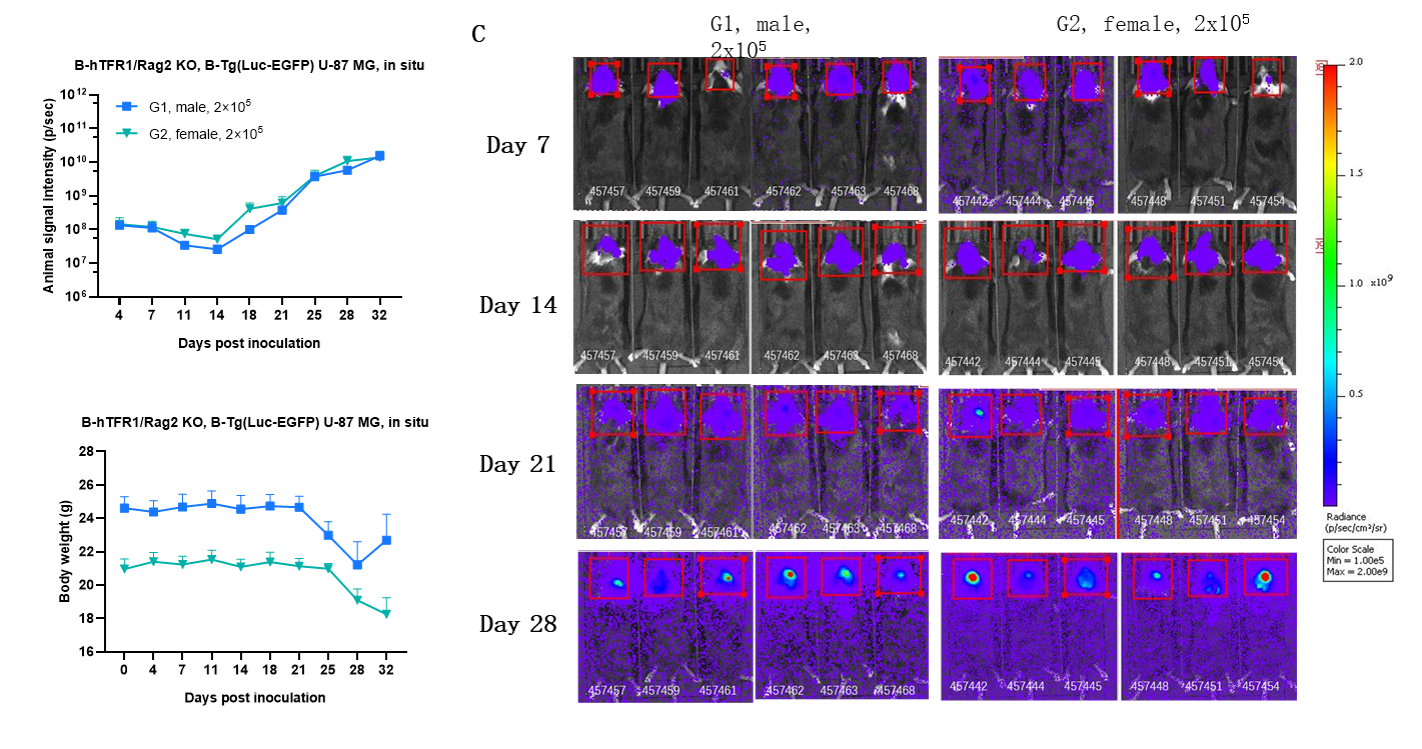
Growth kinetics of B-Tg(Luc-EGFP) U-87 MG tumors determined by bioluminescence imaging (BLI). B-Tg(Luc-EGFP) U-87 MG cells (2x10⁵) were injected into the brain of B-hTFR1/Rag2 KO mice (female and male, 8-week-old, n=6). Signal intensity and body weight were measured twice a week. (A) Signal intensity. (B) Body weight. (C) Raw bioluminescence images. Values are expressed as mean ± SEM.

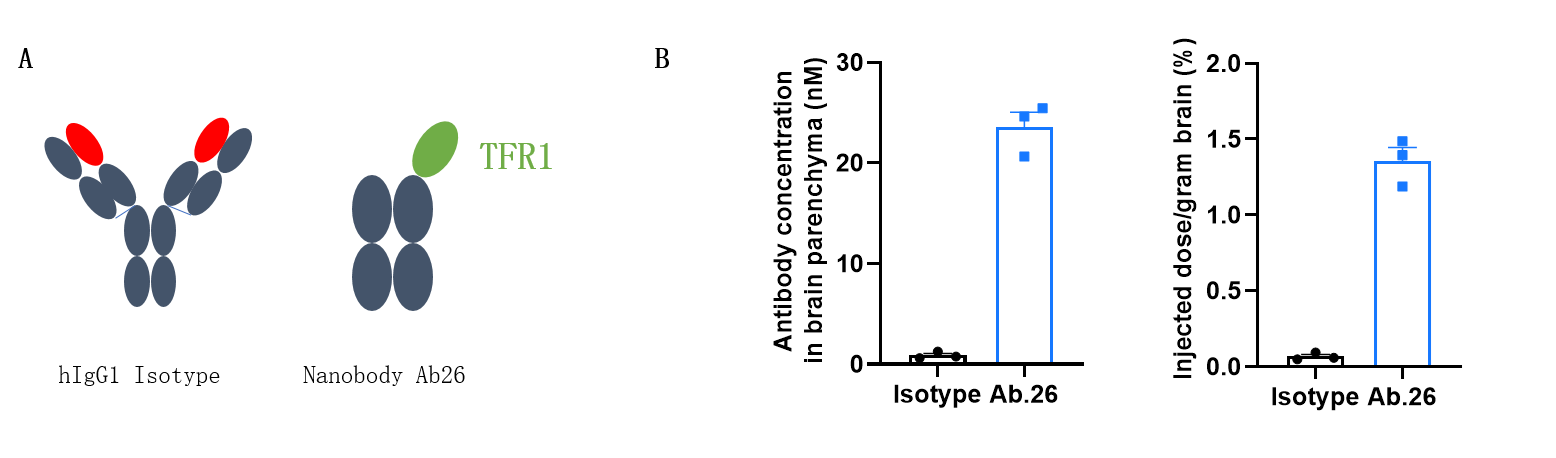
In vivo pharmacokinetic (PK) evaluation of anti-human TFR1 nanobody.
B-hTFR1/Rag2 KO mice were injected with Isotype hIgG (10 mpk) and anti-human TFR1 nanobody Ab.26 (5.5 mpk, produced in-house) via tail vein. Brain were taken for antibody concentration detection after 24 h. (A). Structure of isotype antibody and anti-TFR1 nanobody Ab.26 (This nanobody is independently developed by Biocytogen). (B) Antibody concentrations in brain parenchyma. Graphs represent mean ± SEM.