

C57BL/6-Pdcd1tm3(PDCD1) BcgenCd274tm1(CD274) Bcgen/Bcgen • 112550

PD-1/hPD-L1: An immune-checkpoint and tumor-associated target for therapeutic intervention
•Gene Information: PD-1 (PDCD1/CD279) is an inhibitory immune-checkpoint receptor. PD-L1 (CD274/B7-H1) is a key PD-1 ligand that mediates immune suppression in tumors and antigen-presenting-cell contexts.
•Protein Expression: PD-1 is induced after antigen-specific T-cell stimulation and is often sustained during chronic activation. PD-L1 can be constitutively expressed by tumor cells or induced by IFN-γ and other inflammatory cues.
•Signaling Pathway: PD-L1/PD-1 interaction initiates inhibitory signaling, including dephosphorylation events that suppress TCR downstream signaling. This reduces T-cell activation, cytotoxicity, and tumor-cell killing.
•Therapeutic Inhibition: Anti-PD-1 or anti-PD-L1 monoclonal antibodies block the inhibitory interaction and restore cytotoxic T-cell activity. B-hPD-1 plus/hPD-L1 mice provide an in vivo platform for evaluating PD-1/PD-L1 checkpoint blockade and combination therapies.

PD-1
•A chimeric CDS including human PD-1 gene encoding the signal peptide and extracellular region, mouse PD-1 gene encoding the transmembrane and cytoplasmic region, a stop sequence WPRE were inserted after the initiation codon ATG of mouse PD-1 gene in B-hPD-1 plus/hPD-L1 mice.
•The endogenous mouse promoter and 5′ UTR are retained. The chimeric PD-1 expression is driven by the endogenous mouse PD-1 promoter, while endogenous mouse PD-1 transcription and translation are disrupted.
PD-L1
•Exon 3 of the mouse PD-L1 gene, which encode the IgV domain, was replaced with human PD-L1 exon 3 in B-hPD-1/hPD-L1 mice.
•The endogenous mouse promoter, 5′ UTR, 3′ UTR, and genomic regions encoding the signal peptide, non-IgV domain of the Extracellular domain, transmembrane and cytoplasmic domains are retained. The chimeric PD-L1 expression is driven by the endogenous mouse PD-L1 promoter, while endogenous mouse PD-L1 transcription and translation are disrupted.

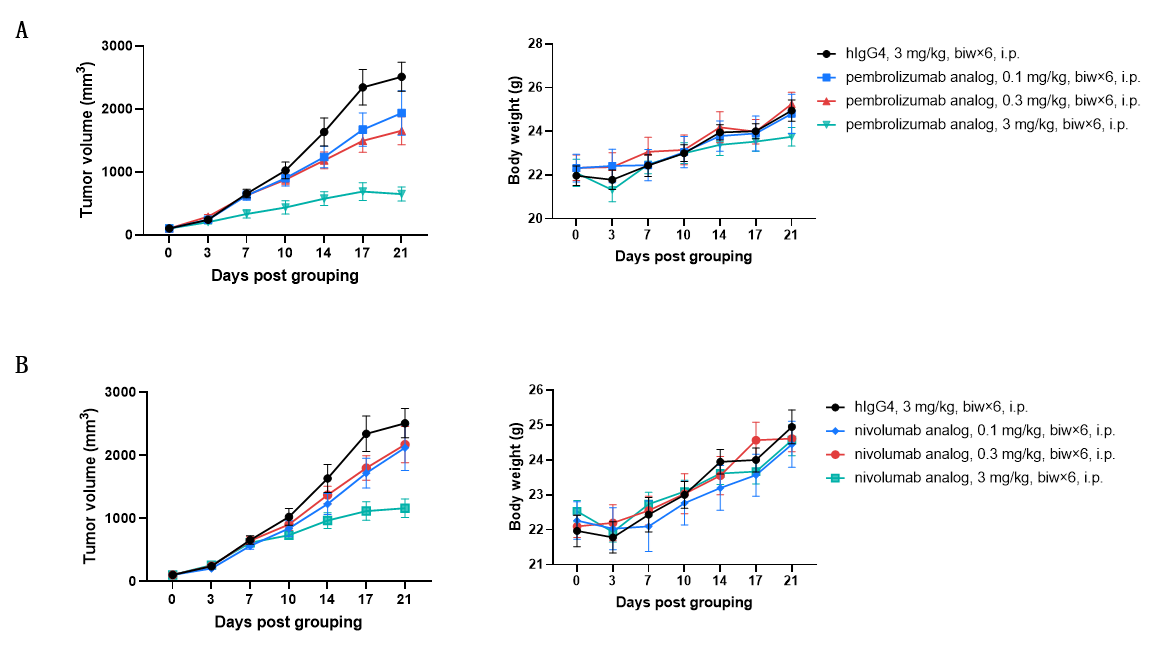
Anti-human PD-1 antibody pembrolizumab analog (in-house) and nivolumab analog (in-house) inhibited the growth of B-hPD-L1 MC38 plus in B-hPD-1 plus/PD-L1 mice. Murine colon cancer B-hPD-L1 MC38 plus cells were subcutaneously implanted into B-hPD-1 plus/PD-L1 mice (female, 8-week-old, n=6). Mice were grouped when tumor volume reached approximately 80-120 mm3, at which time they were treated with anti-human PD-1 antibodies with doses indicated in panel. (A) Tumor volume and body weight of mice treated with pembrolizumab analog. (B) Tumor volume and body weight of mice treated with nivolumab analog. Results showed that pembrolizumab analog and nivolumab analog were both efficacious in controlling tumor growth in B-hPD-1 plus/PD-L1 mice. The tumor inhibitory effects were dose-dependent. Values are expressed as mean ± SEM.
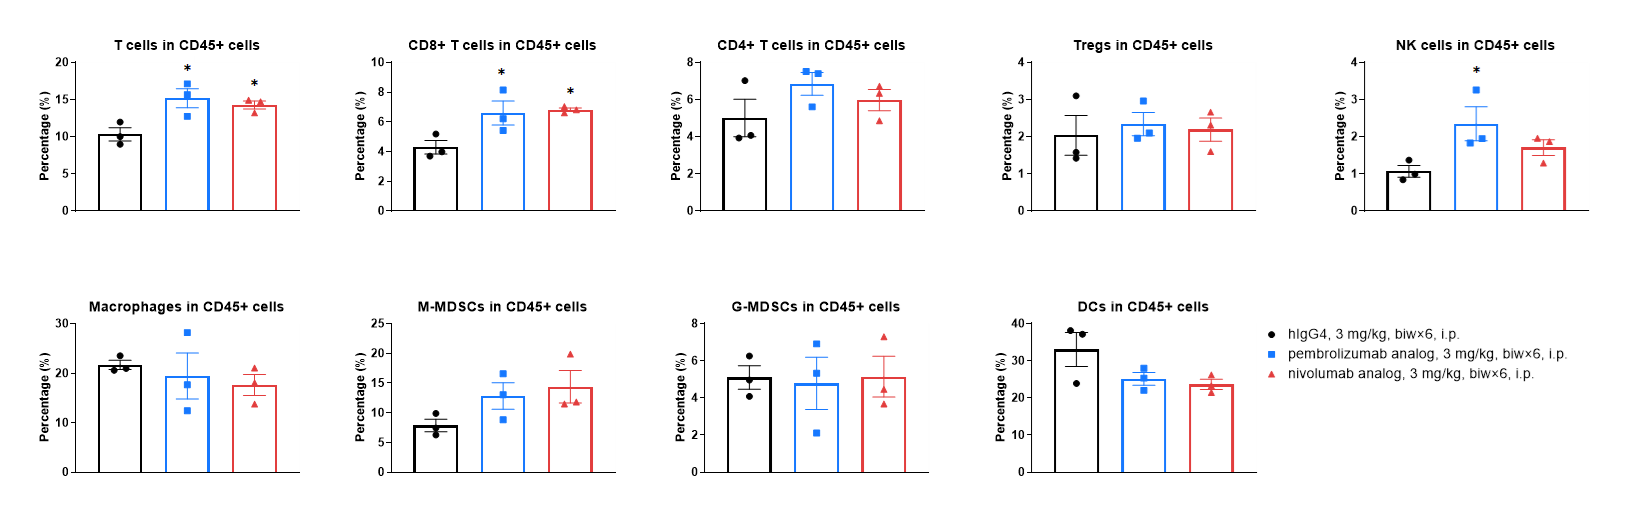
Flow cytometry analysis of tumor infiltrating lymphocytes (TILs). Tumors were collected at the endpoint from B-hPD-L1 MC38 plus-bearing B-hPD-1 plus/hPD-L1 mice (n=3). Tumor-infiltrating lymphocytes were analyzed by flow cytometry to compare CD45+ immune-cell infiltration in pembrolizumab analog- and nivolumab analog-treated groups versus the isotype control group. Values are expressed as mean ± SEM.
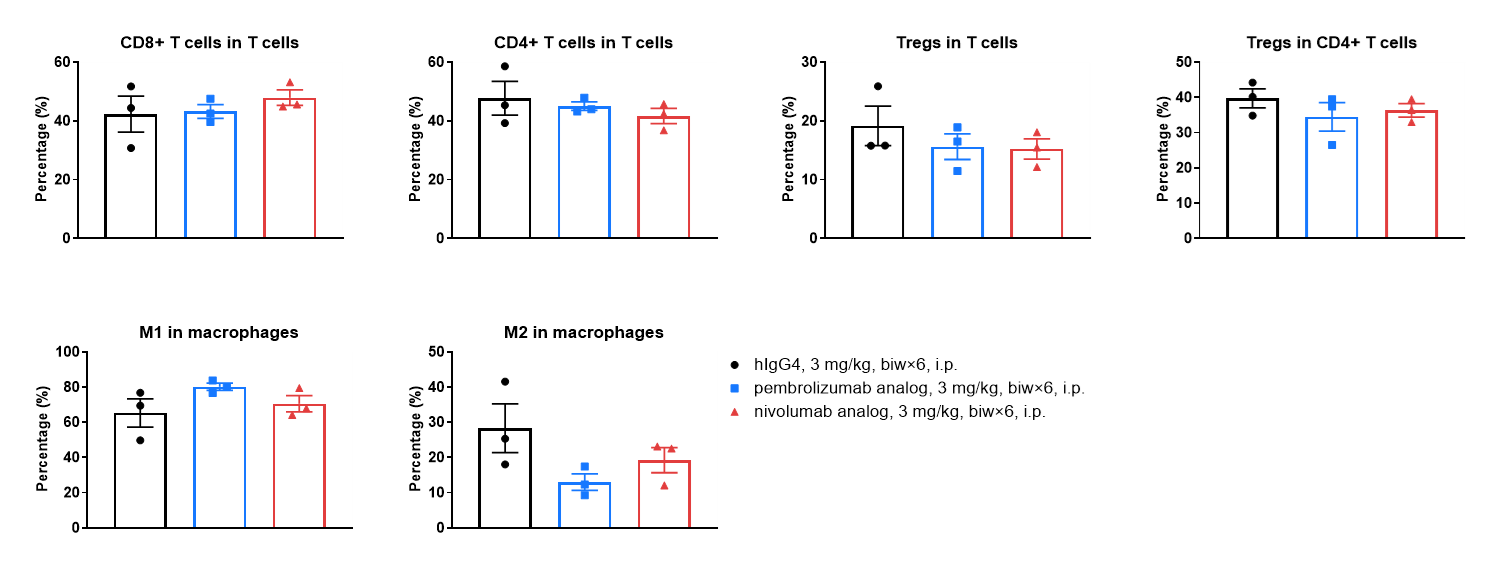
Flow cytometry analysis of leukocyte subpopulations in TILs. Tumors were collected at the endpoint from B-hPD-L1 MC38 plus-bearing B-hPD-1 plus/hPD-L1 mice (n=3). TILs were analyzed to quantify major leukocyte subpopulations after pembrolizumab analog or nivolumab analog treatment compared with isotype control. Values are expressed as mean ± SEM.
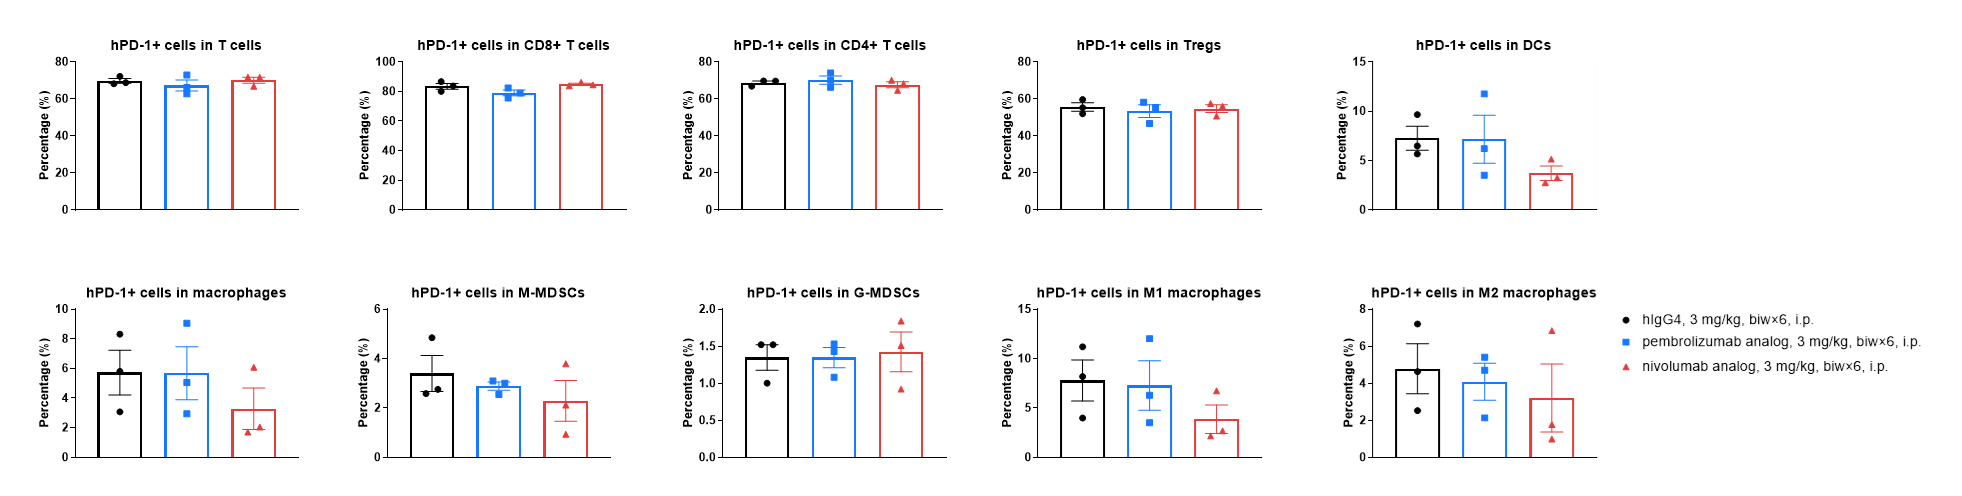
Analysis of hPD-1+ cells in TILs by flow cytometry. Tumors were collected at the endpoint from B-hPD-L1 MC38 plus-bearing B-hPD-1 plus/hPD-L1 mice (n=3). Flow cytometry was used to evaluate the percentages of hPD-1+ cells within indicated TIL populations after pembrolizumab analog or nivolumab analog treatment compared with isotype control. Values are expressed as mean ± SEM.
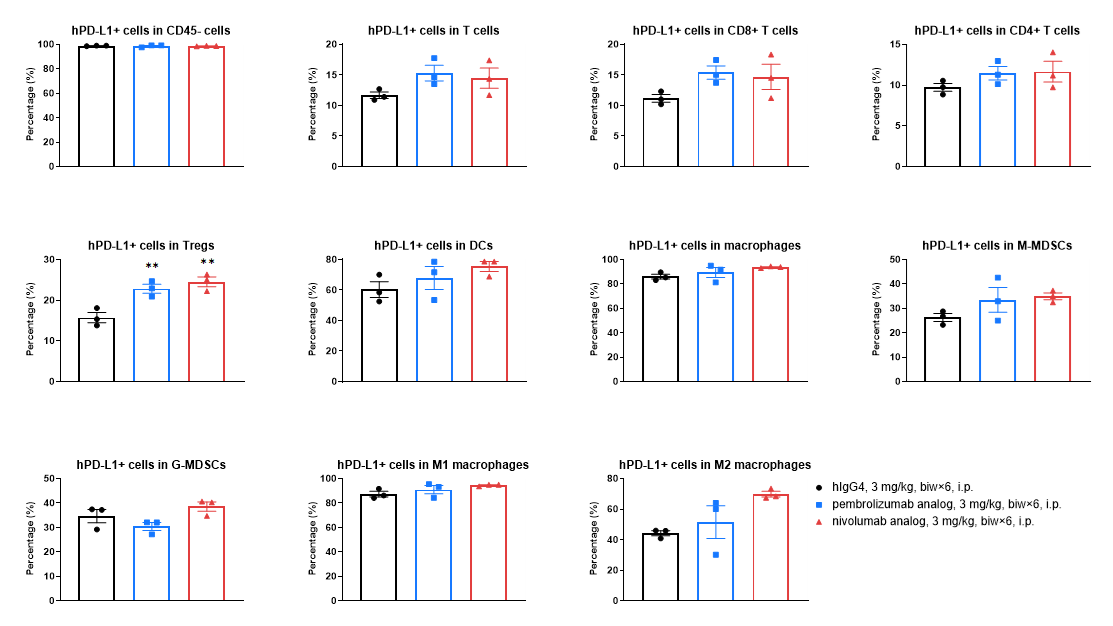
Analysis of hPD-L1+ cells in tumor tissue by flow cytometry. Tumors were collected at the endpoint from B-hPD-L1 MC38 plus-bearing B-hPD-1 plus/hPD-L1 mice (n=3). Flow cytometry was performed to quantify hPD-L1+ cells in tumor tissue after pembrolizumab analog or nivolumab analog treatment compared with isotype control. Values are expressed as mean ± SEM.
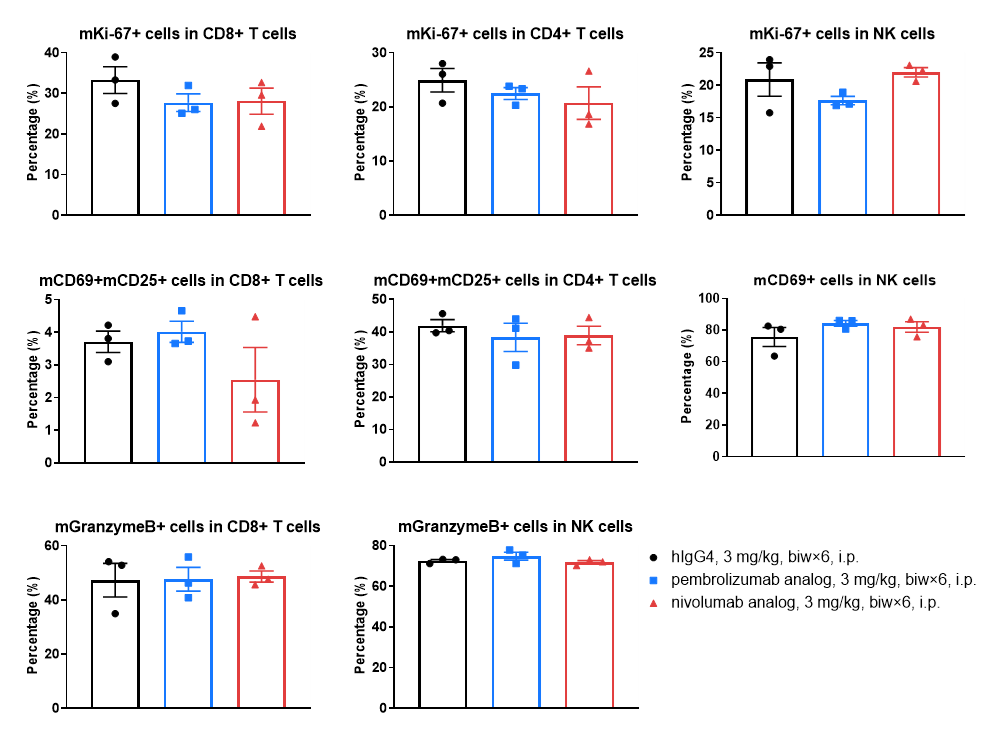
Flow cytometry analysis of activated cells in TILs. Tumors were collected at the endpoint from B-hPD-L1 MC38 plus-bearing B-hPD-1 plus/hPD-L1 mice (n=3). TILs were analyzed by flow cytometry to assess activation-marker-positive immune-cell populations after pembrolizumab analog or nivolumab analog treatment compared with isotype control. Values are expressed as mean ± SEM.
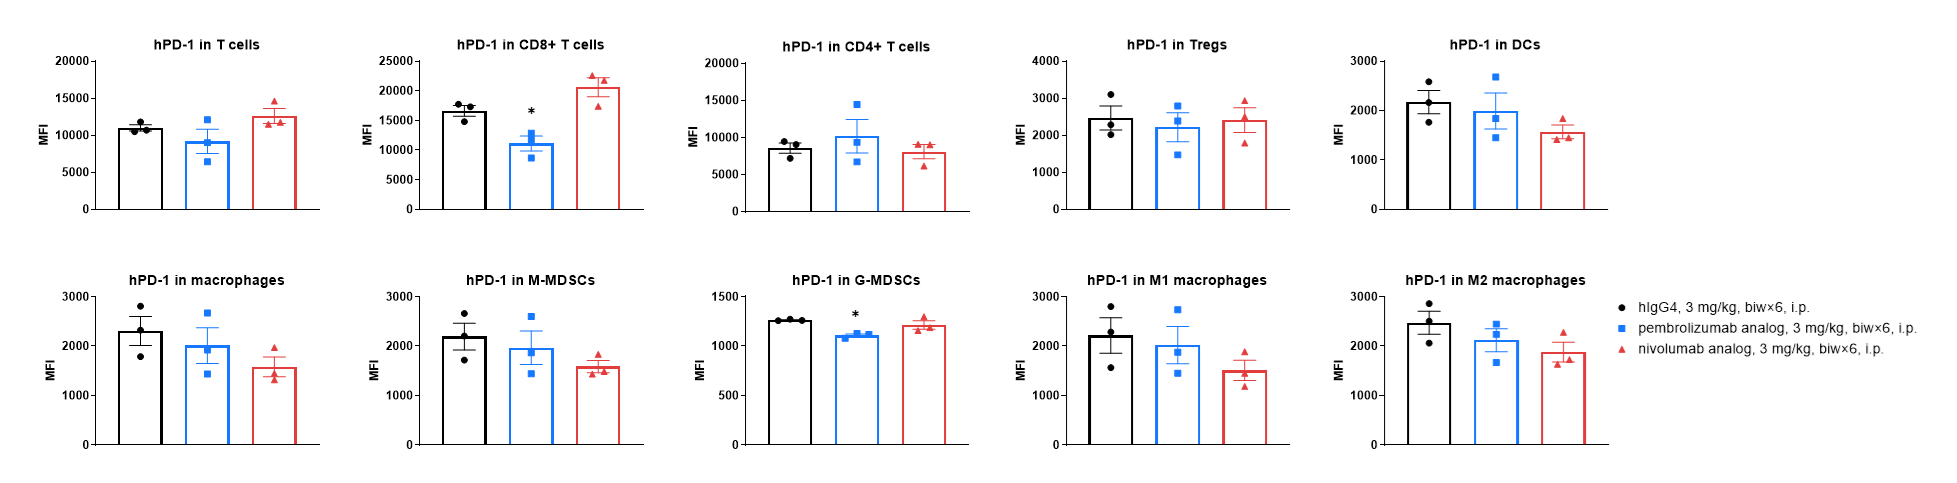
Analysis of hPD-1 expression levels on TILs by flow cytometry. Tumors were collected at the endpoint from B-hPD-L1 MC38 plus-bearing B-hPD-1 plus/hPD-L1 mice (n=3). Flow cytometry was used to evaluate hPD-1 expression levels on indicated TIL populations after pembrolizumab analog or nivolumab analog treatment compared with isotype control. Values are expressed as mean ± SEM.
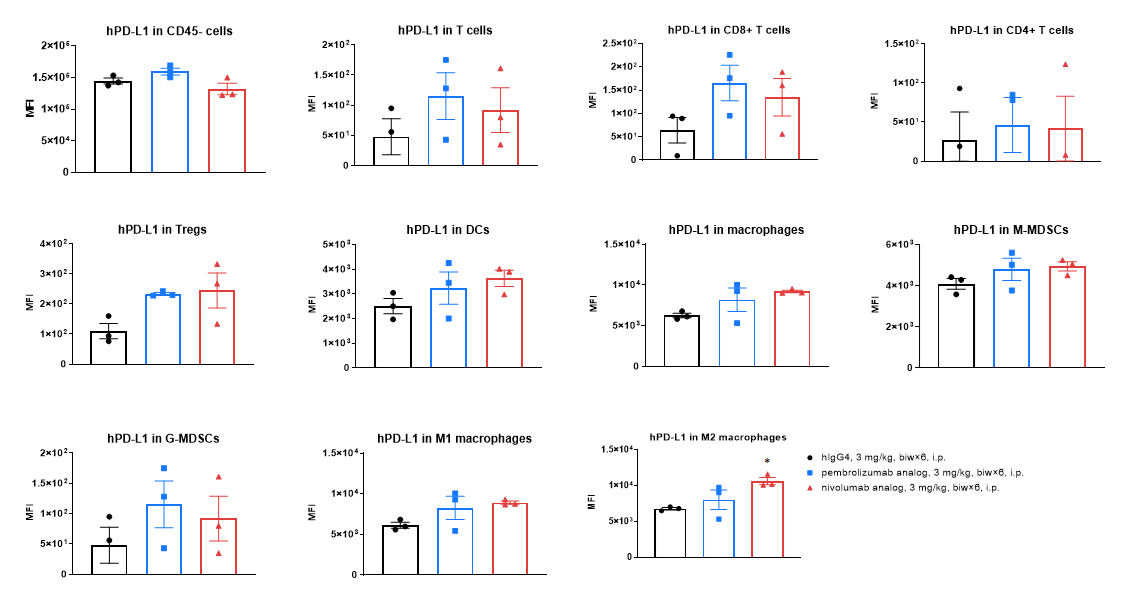
Analysis of hPD-L1 expression levels in tumor-infiltrating cells by flow cytometry. Tumors were collected at the endpoint from B-hPD-L1 MC38 plus-bearing B-hPD-1 plus/hPD-L1 mice (n=3). Flow cytometry was used to evaluate hPD-L1 expression levels in indicated tumor-infiltrating cell populations after pembrolizumab analog or nivolumab analog treatment compared with isotype control. Values are expressed as mean ± SEM.