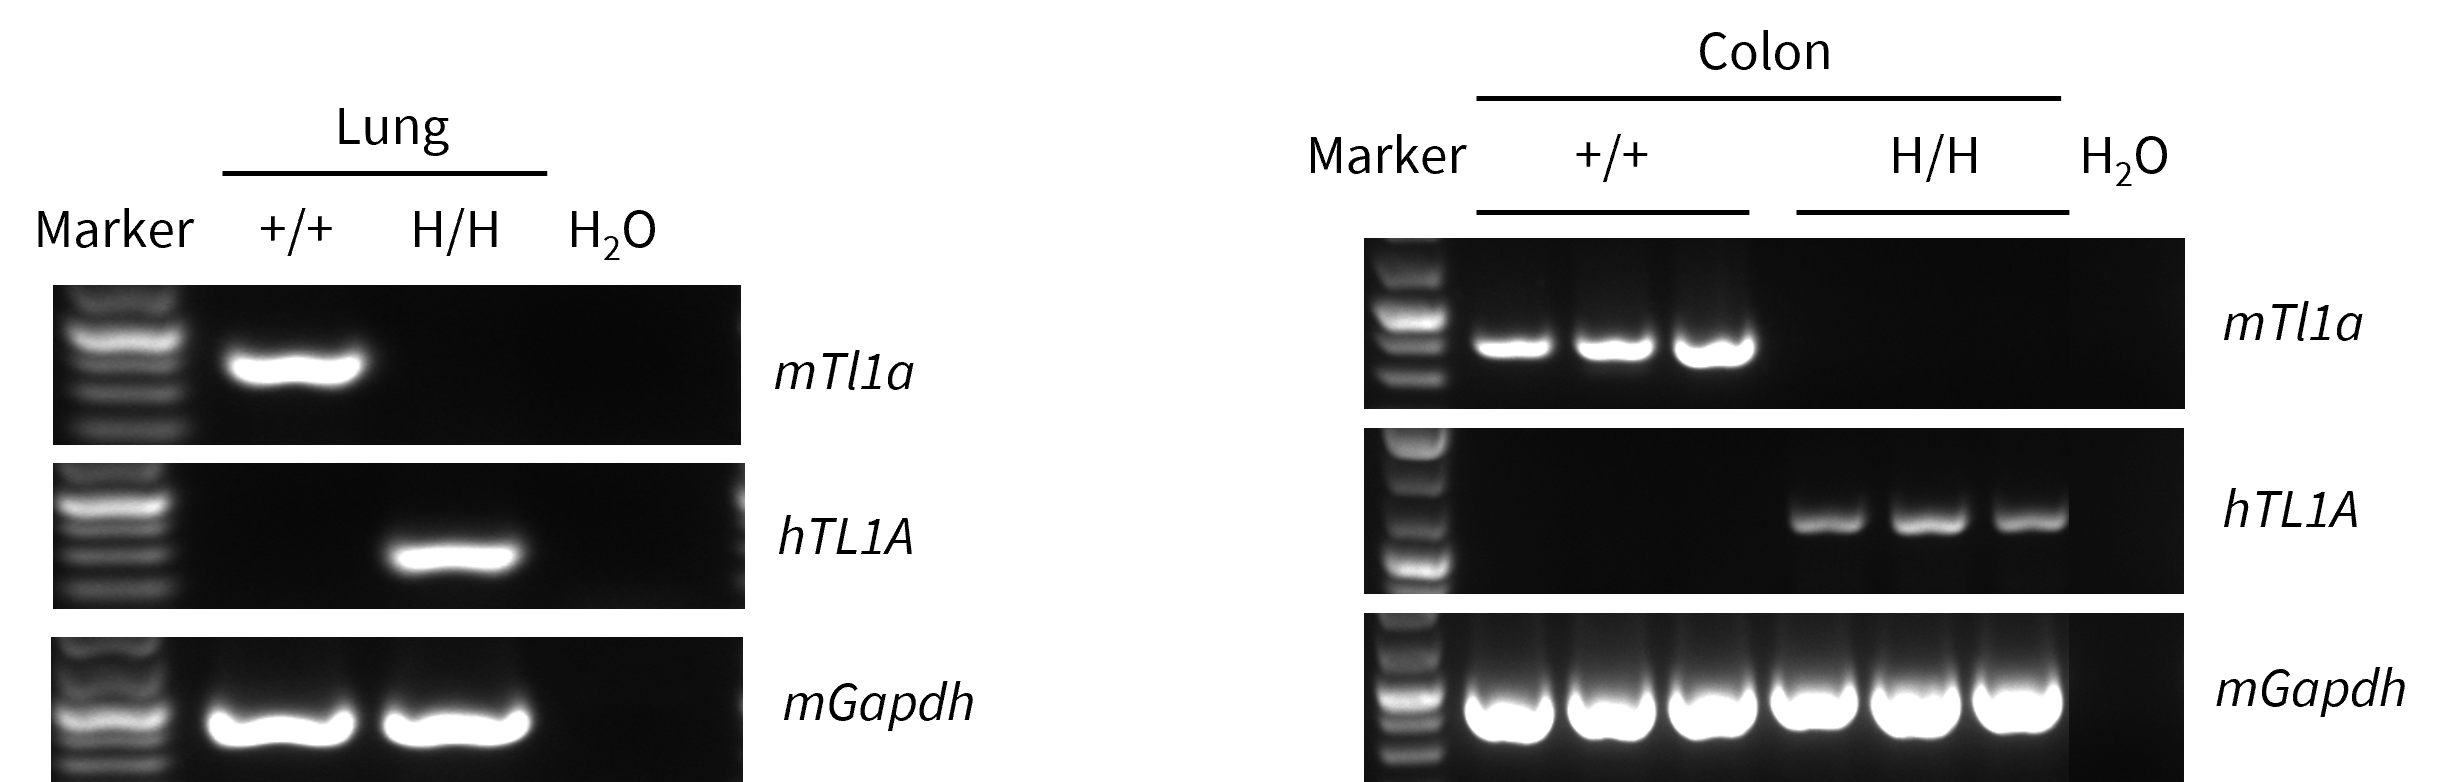
TL1A mRNA Expression Analysis
- Human TL1A mRNA was specifically and correctly expressed in B-hTL1A mice.
Strain specific analysis of TL1A gene expression in wild-type (WT) mice and B-hTL1A mice by RT-PCR. Lung and colon tissues were collected from wild-type C57BL/6 mice (+/+) and homozygous B-hTL1A mice (H/H). Mouse Tl1a mRNA was detectable only in lung and colon of wild-type C57BL/6 mice. Human TL1A mRNA was detectable only in homozygous B-hTL1A mice but not in wild-type C57BL/6 mice.
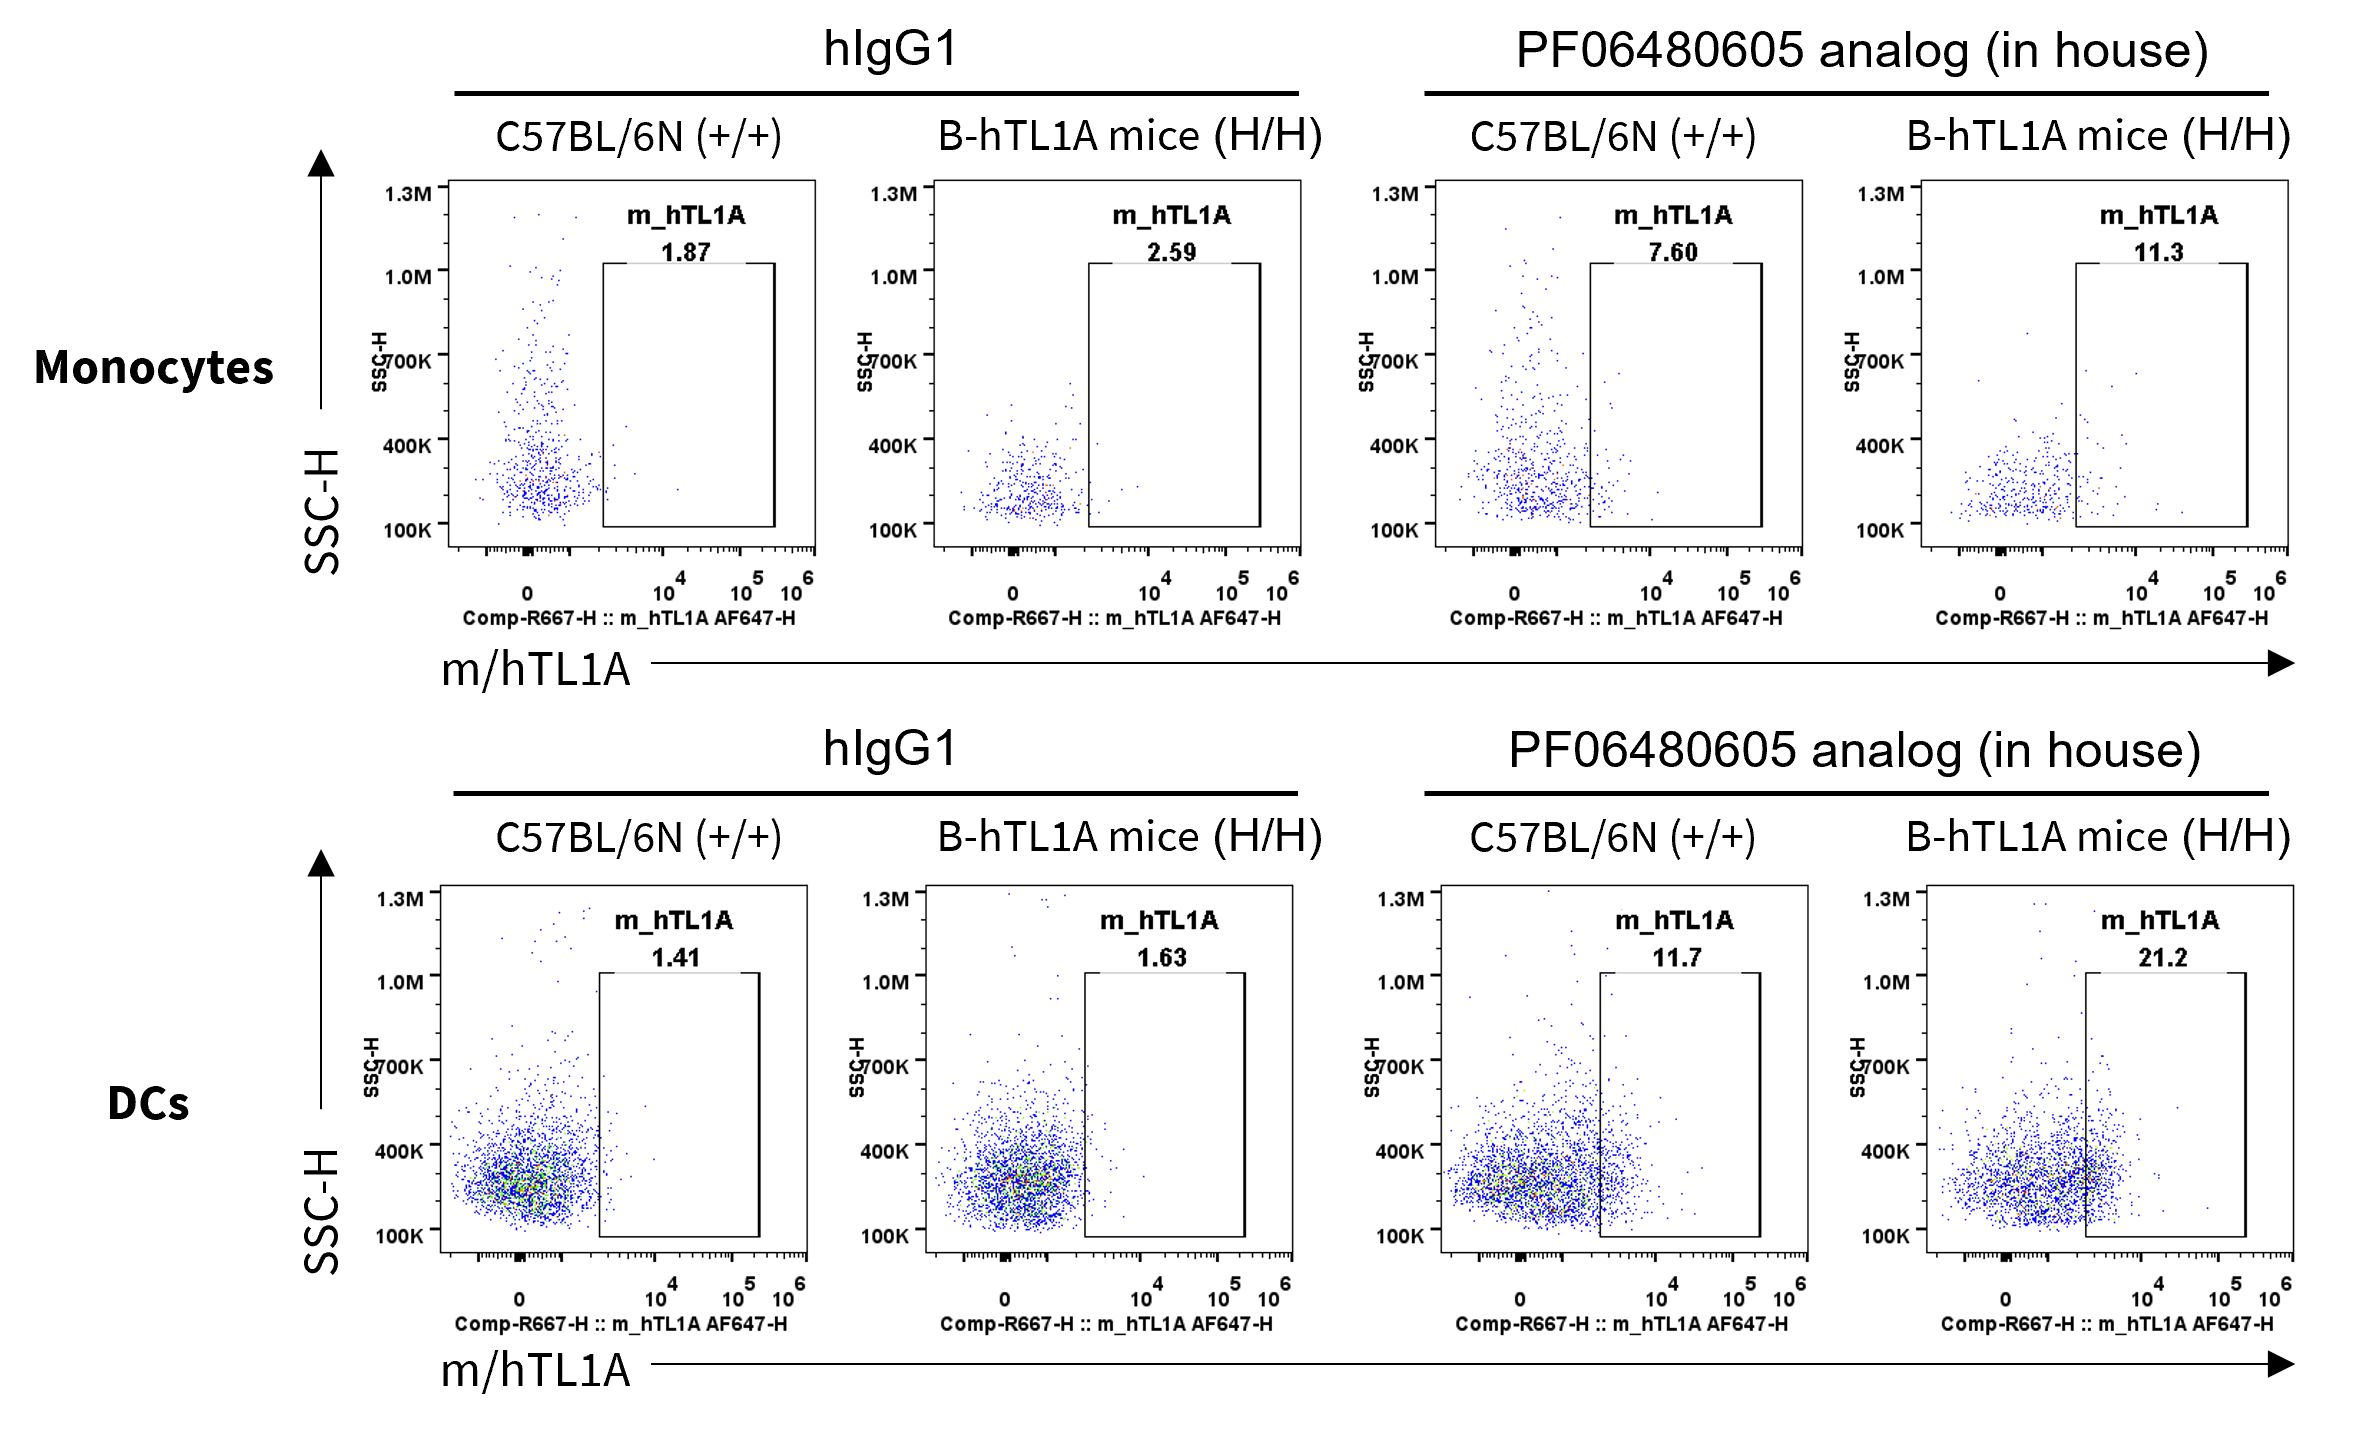
Membrane Bound TL1A Protein Expression Analysis
- Mouse/human membrane bound TL1A was detectable on monocytes and DCs of wild-type C57BL/6N mice and homozygous B-hTL1A mice.
Strain specific TL1A expression analysis in wild-type C57BL/6N mice and homozygous humanized B-hTL1A mice by flow cytometry. Splenocytes were collected from wild-type C57BL/6N mice (+/+) and homozygous B-hTL1A mice (H/H), protein expression was analyzed by flow cytometry with PF06480605 analog (in house). Mouse/human membrane bound TL1A was detectable on monocytes and DCs of wild-type C57BL/6N mice and homozygous B-hTL1A mice, as the PF06480605 antibody was cross-reactive between mouse and human.
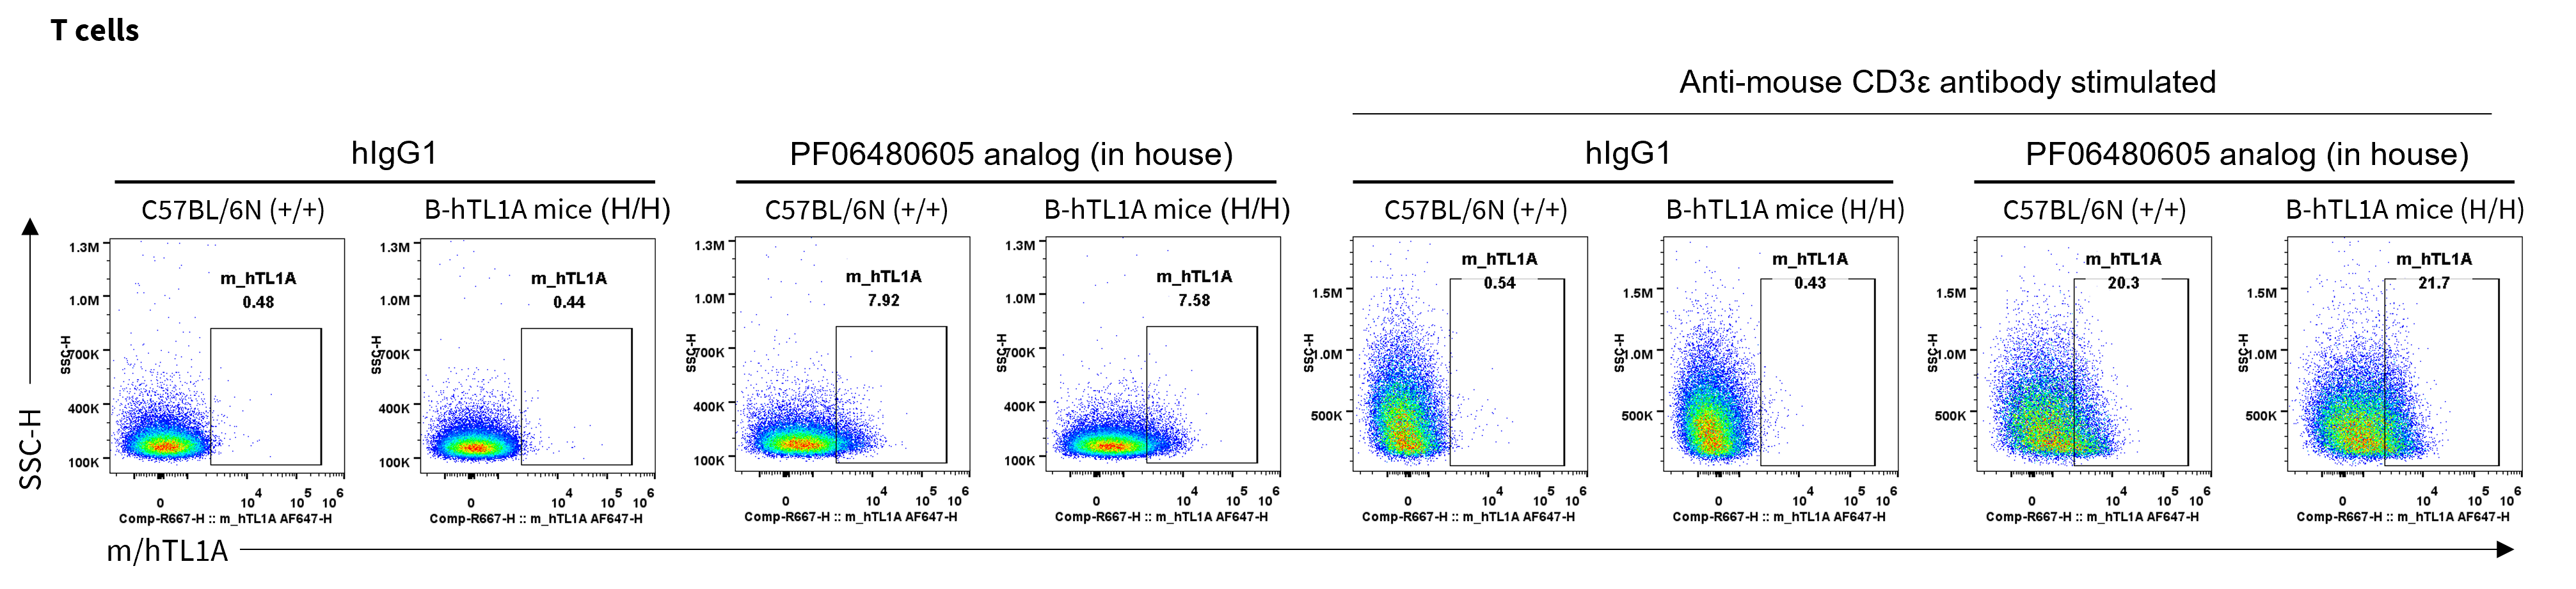
- Mouse/human membrane bound TL1A was detectable on T cells of wild-type C57BL/6N mice and homozygous B-hTL1A mice.
Strain specific TL1A expression analysis in wild-type C57BL/6N mice and homozygous humanized B-hTL1A mice by flow cytometry. Splenocytes were collected from wild-type C57BL/6N mice (+/+) and homozygous B-hTL1A mice(H/H) stimulated with anti-mouse CD3ε antibody in vivo for 24 hrs, protein expression was analyzed by flow cytometry with PF06480605 analog (in house). Mouse/human membrane bound TL1A was detectable on T cells of wild-type C57BL/6N mice and homozygous B-hTL1A mice, as the PF06480605 antibody was cross-reactive between mouse and human.
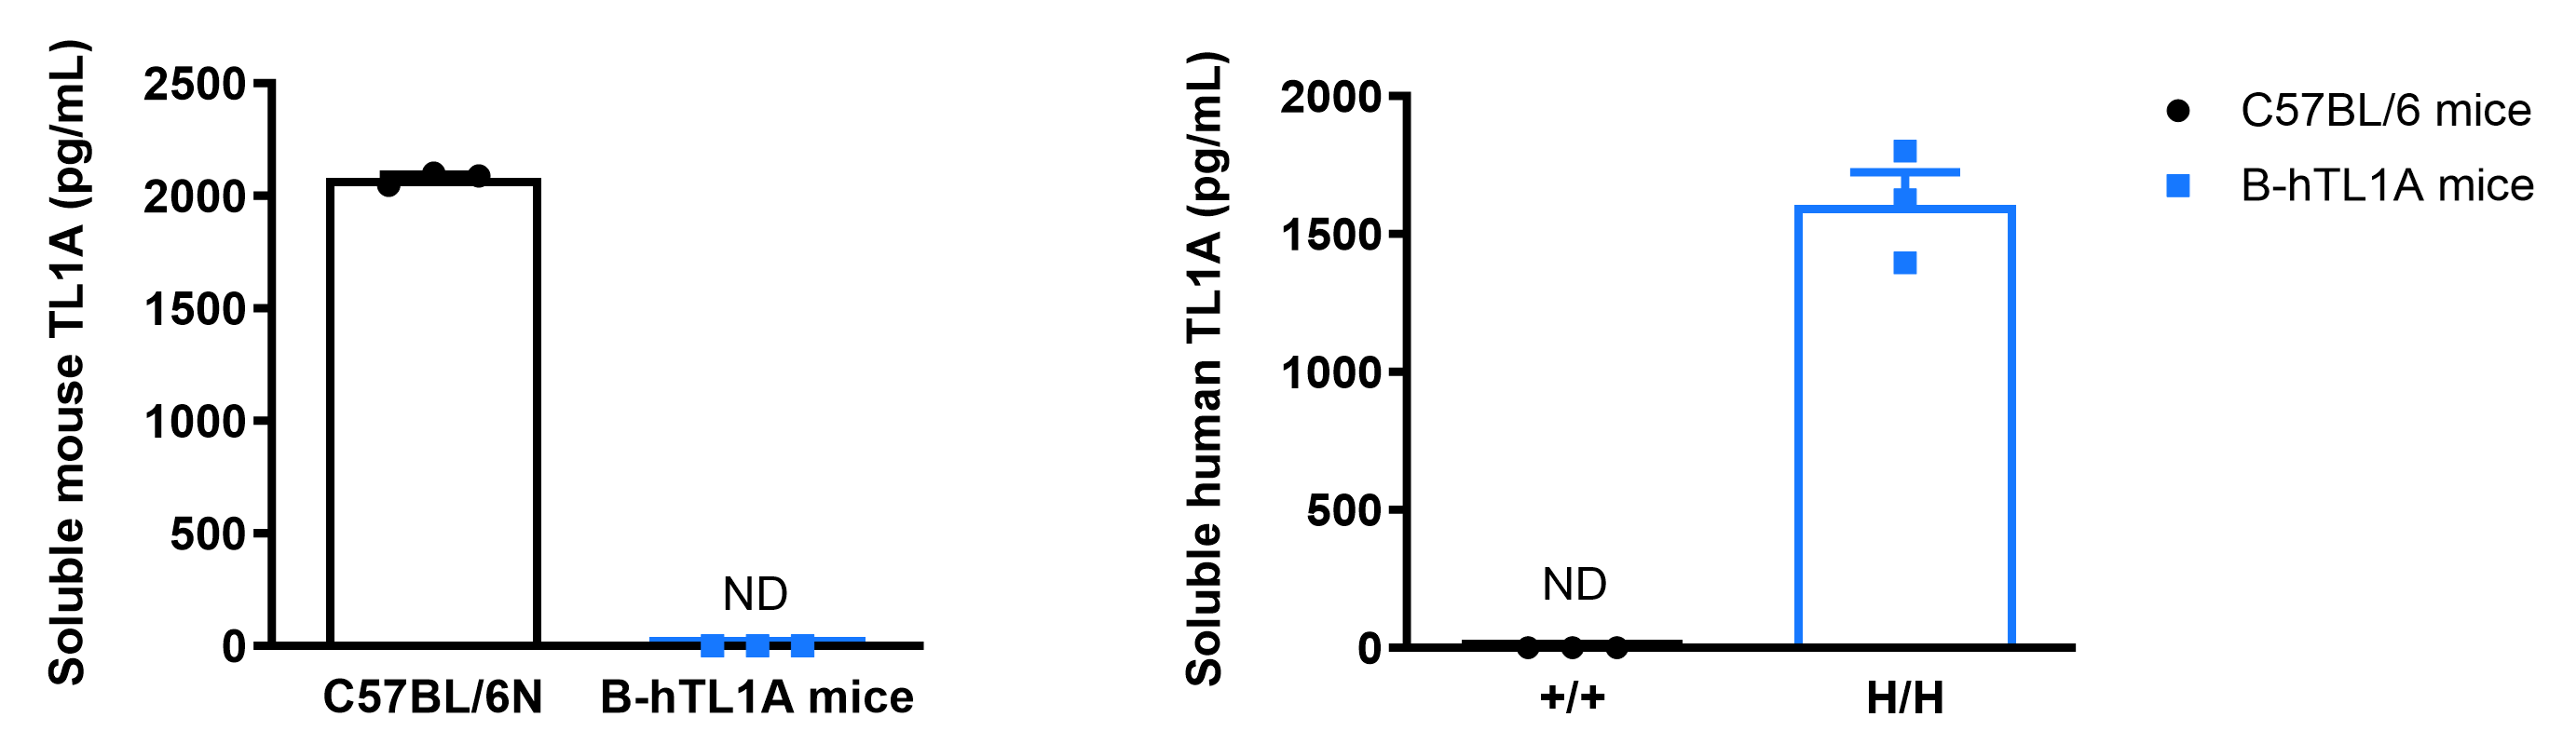
Soluble TL1A Protein Expression Analysis
- Soluble human TL1A was exclusively detectable in homozygous B-hTL1A mice but not wild-type C57BL/6 mice.
Soluble TL1A expression analysis in B-hTL1A mice by ELISA. Bone marrow derived dendritic cells (BMDCs) were produced by culturing the bone marrow from wild-type C57BL/6 mice (+/+) and homozygous B-hTL1A mice (H/H) (male, 6 weeks-old, n=3), which were stimulated with LPS in vitro. After stimulation, the supernatants were collected and the levels of soluble TL1A were measured using the species-specific mouse and human TL1A ELISA kit. Soluble mouse TL1A was detectable in wild-type C57BL/6 mice. Soluble human TL1A was exclusively detectable in homozygous B-hTL1A mice but not wild-type C57BL/6 mice. Values are expressed as mean ± SEM. ND: not detectable.
- Soluble human TL1A was exclusively detectable in homozygous B-hTL1A mice but not wild-type C57BL/6 mice.
Soluble TL1A expression analysis in B-hTL1A mice by ELISA. Serum were collected from wild-type C57BL/6N mice (+/+) and homozygous B-hTL1A mice (H/H) stimulated with LPS in vivo for 4h, and analyzed by ELISA with species-specific human TL1A ELISA kit. Soluble human TL1A was detectable in homozygous B-hTL1A mice but not wild-type C57BL/6N mice. LPS stimulation could increase the expression of human TL1A protein. Values are expressed as mean ± SEM. ND: not detectable.
Analysis of Leukocyte Subpopulations
- The percentages of T cells, B cells, NK cells, DCs, monocytes, macrophages, and neutrophils in homozygous B-hTL1A mice were similar to those in C57BL/6N mice.
- Humanization of TL1A does not affect normal immune cell development or splenic distribution.
Analysis of leukocyte subpopulations by flow cytometry in immune organs and blood. Splenocytes, peripheral blood, and lymph nodes were isolated from female C57BL/6N and B-hTL1A mice (female, 7-week-old, n = 3). Single live cells were gated on the CD45⁺ population and analyzed by flow cytometry as indicated. Values are expressed as mean ± SEM.
Analysis of T Cell Subpopulations
- The proportions of CD4⁺ T cells, CD8⁺ T cells, and Tregs in homozygous B-hTL1A mice were comparable to those in C57BL/6N mice.
- Humanization of TL1A does not affect normal T cell development, differentiation, or splenic distribution.
Analysis of T-cell subpopulations by flow cytometry in immune organs and blood. Splenocytes, peripheral blood, and lymph nodes were isolated from female C57BL/6N and B-hTL1A mice (female, 7-week-old, n = 3). Single live cells were gated on the CD3⁺ T-cell population and analyzed by flow cytometry as indicated. Values are expressed as mean ± SEM.
Functional Validation
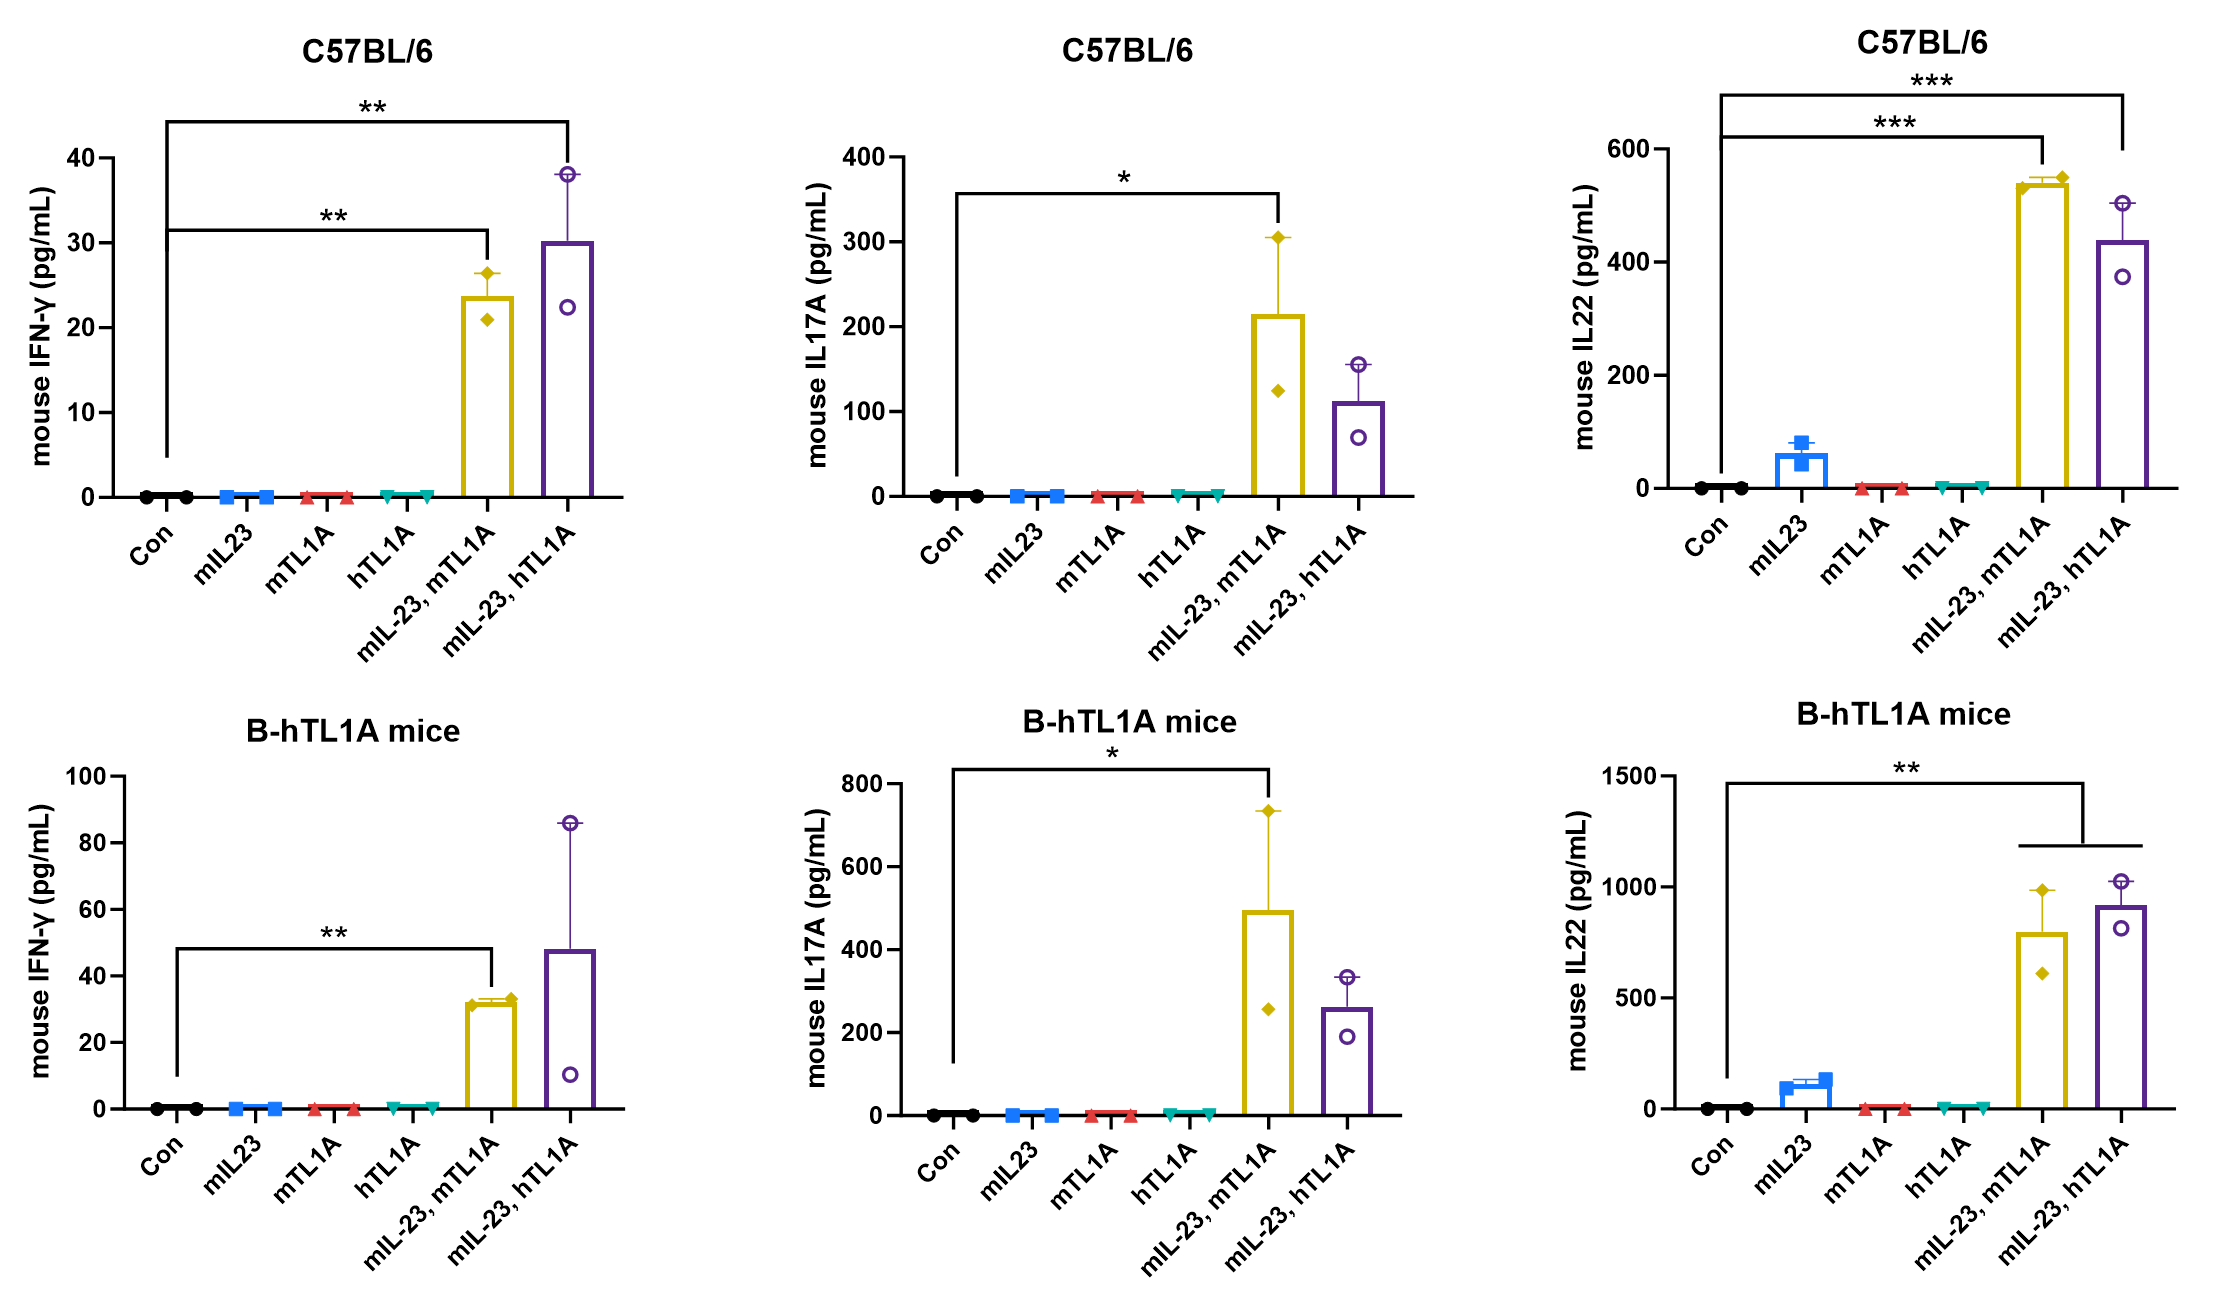
- The synergistic stimulation of TL1A and IL23 could promote the production of downstream cytokines in wild-type C57BL/6 mice and homozygous B-hTL1A mice.
- Both mTL1A and hTL1A could bind to mouse DR3.
Ex vivo functional analysis in B-hTL1A mice. Splenocytes were collected from wild-type C57BL/6 mice (+/+) and homozygous B-hTL1A mice (H/H), then the production of mouse IFN-γ, mouse IL17A, and mouse IL22 in supernatants were assessed by ELISA after 72 h of incubation with mIL23 (10 ng/mL), mTL1A (300 ng/mL), and hTL1A (300 ng/mL) in vitro.
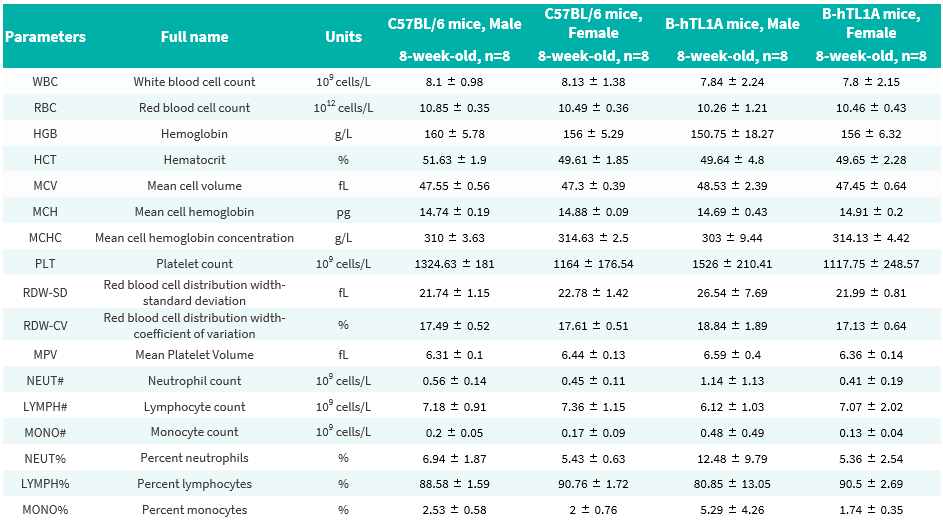
Hematology Analysis
- No significant differences were observed compared with wild-type mice.
Complete blood count (CBC) of B-hTL1A mice. Values are expressed as mean ± SD.
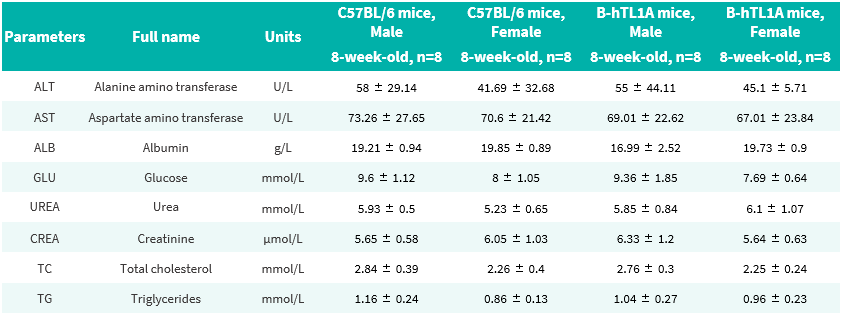
Blood Biochemical Analysis
- No significant differences were observed compared with wild-type mice.
Blood biochemical parameters of B-hTL1A mice are shown. Values are expressed as mean ± SD.
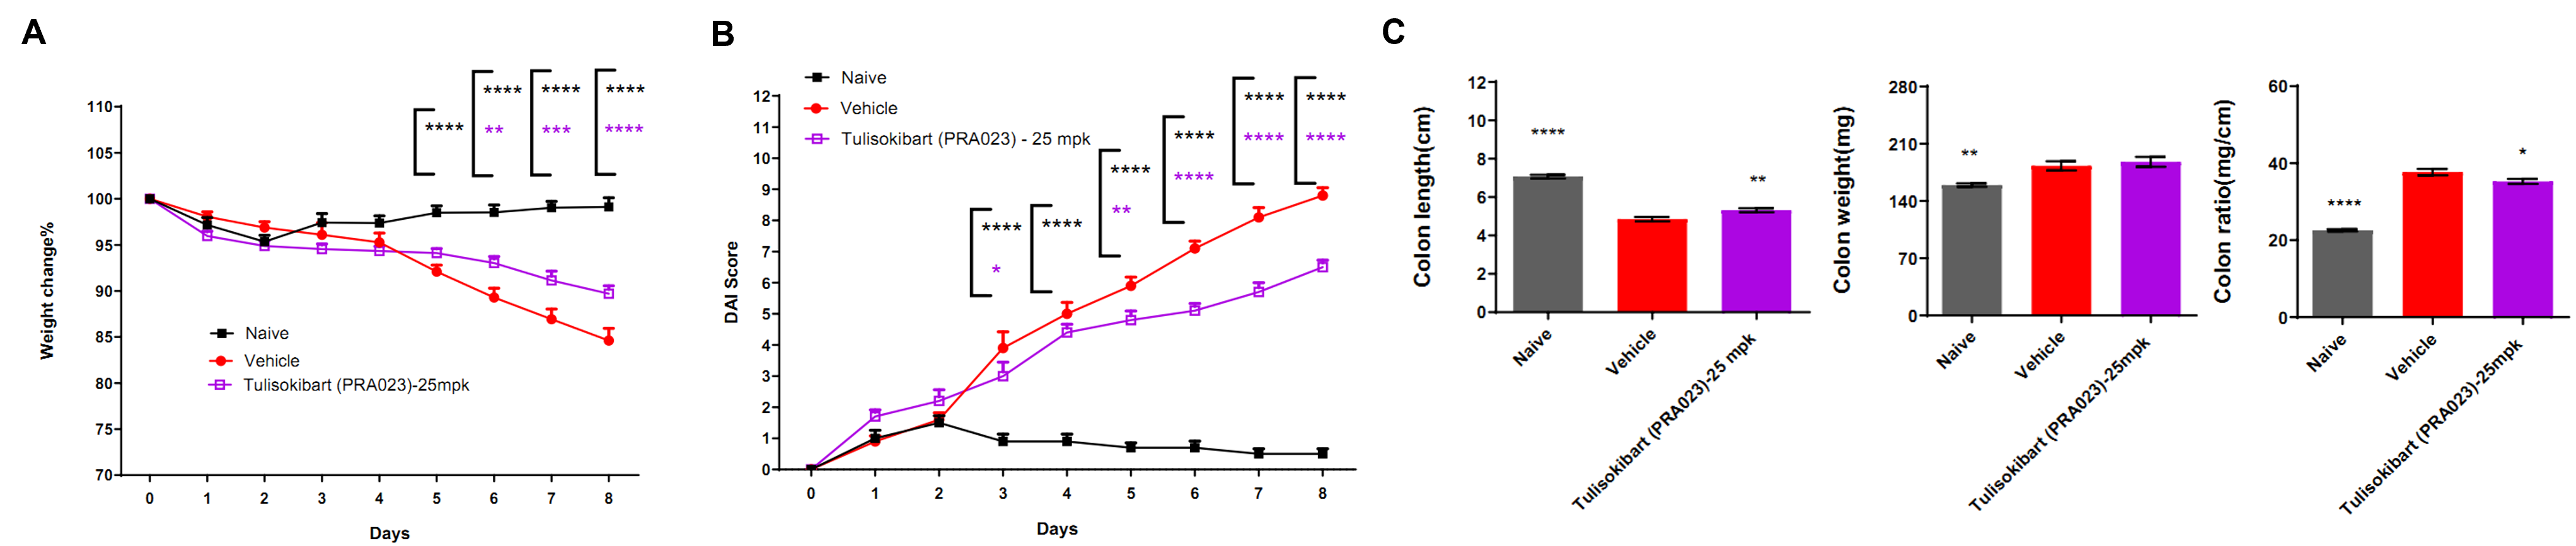
In Vivo Efficacy of Anti-Human TL1A Antibody in a TNBS Induced Acute Colitis
- Tulisokibart (PRA023) treatment efficiently improved TNBS-induced acute colitis.
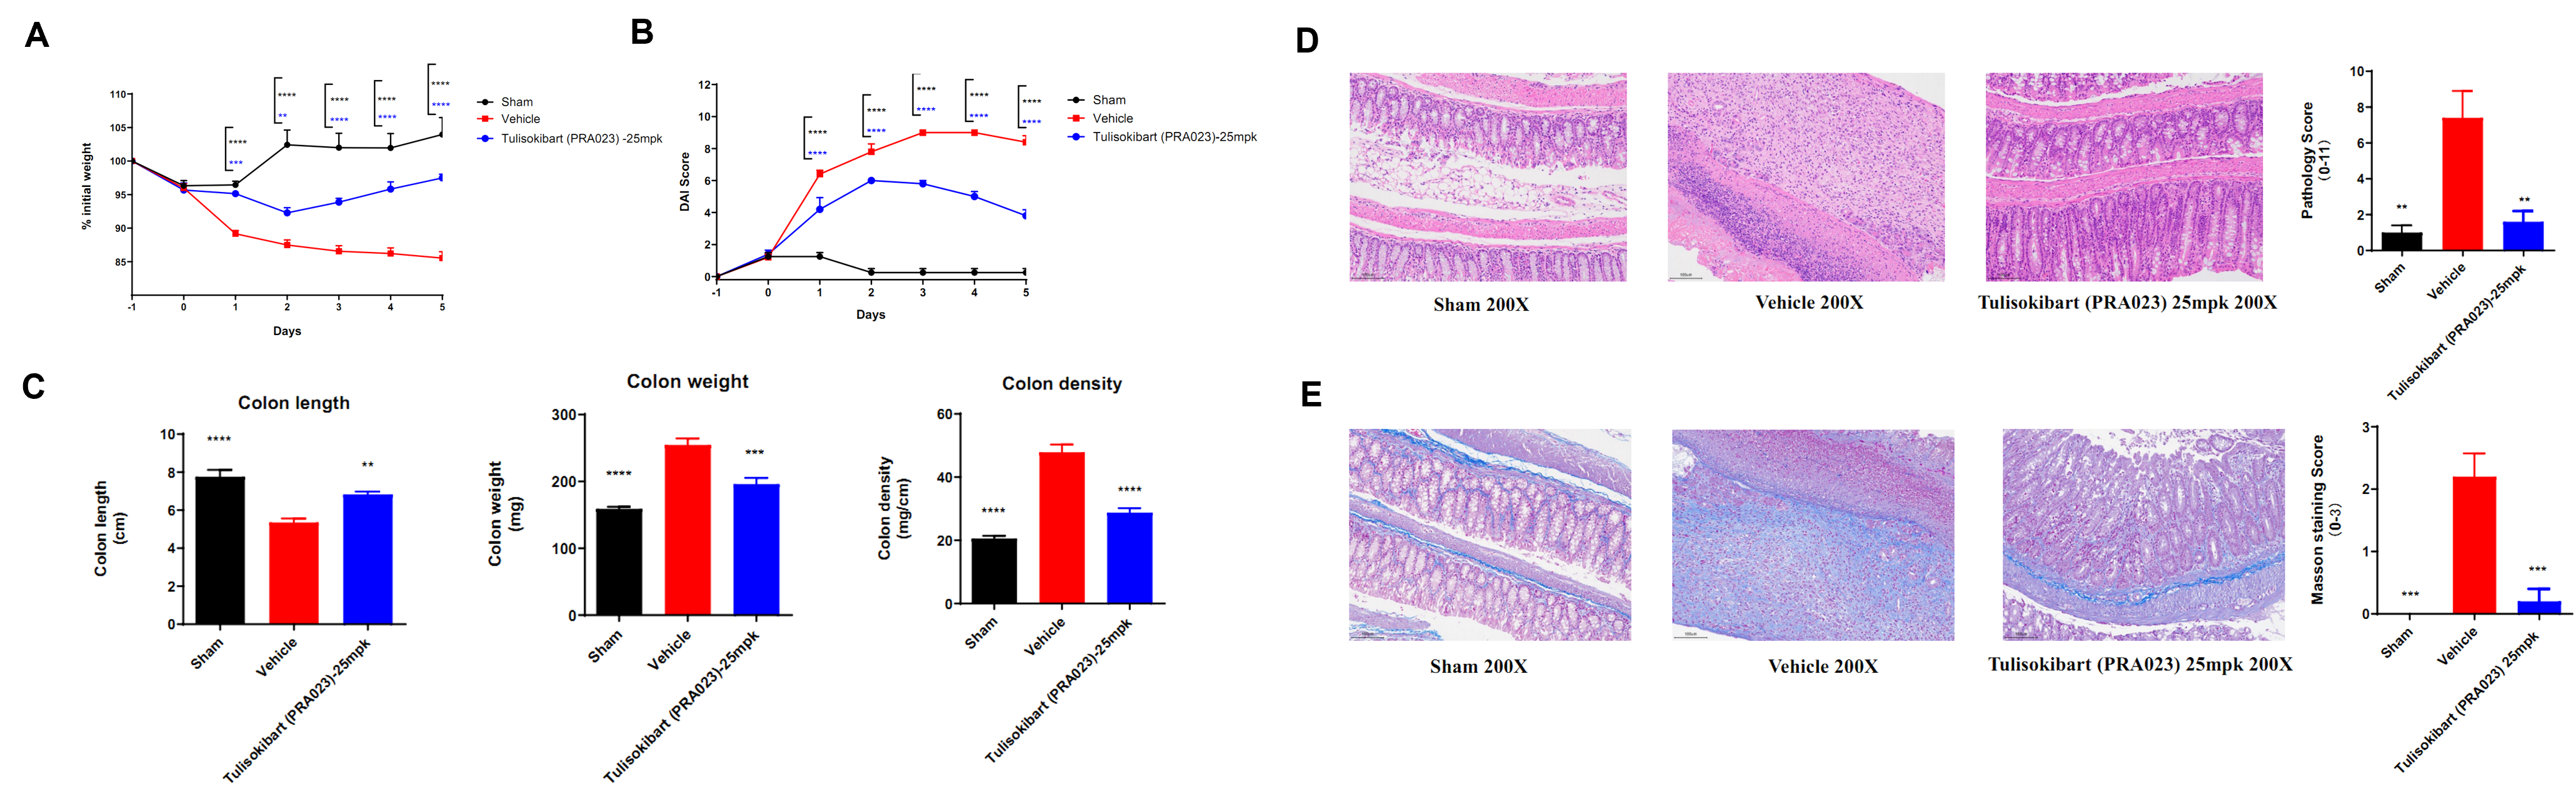
The therapeutic efficacy of anti-human TL1A antibody on the TNBS-induced acute colitis model in B-hTL1A mice. TNBS solution was instilled into the colon lumen of B-hTL1A mice (female, 8-10 weeks-old, n=8). The control group (Sham) received intrarectal injections of PBS. Tulisokibart (PRA023) at a dose of 25 mpk (provided by WuXi AppTec) was administered to the treatment group. (A) Body weight change. (B) DAI score. (C) Colon Index. (D) Pathological score. (E) Masson staining score. An acute colitis disease model induced by TNBS was established in B-hTL1A mice, and the administration of the anti-human TL1A antibody Tulisokibart (PRA023) efficiently improved TNBS-induced acute colitis. The results indicate that B-hTL1A mice are a powerful tool for assessing the in vivo efficacy of anti-human TL1A antibodies. Values are expressed as mean ± SEM. *p<0.05, **p<0.01, ***p<0.001, ****p<0.0001 versus Vehicle, ANOVA.
Note: This experiment was conducted by WuXi AppTec using B-hTL1A mice.
In Vivo Efficacy of Anti-Human TL1A Antibody in a DSS Induced Acute Colitis
- Tulisokibart (PRA023) treatment efficiently improved DSS-induced acute colitis.
The therapeutic efficacy of anti-human TL1A antibody on the DSS-induced acute colitis model in B-hTL1A mice. B-hTL1A mice (female, 7-8 weeks-old, n=8) were provided with drinking water containing DSS for 9 consecutive days. Tulisokibart (PRA023) at a dose of 25 mpk (provided by WuXi AppTec) was administered to the treatment group. (A) Body weight change. (B) DAI score. (C) Colon Index. An acute colitis disease model induced by DSS was established in B-hTL1A mice, and the administration of the anti-human TL1A antibody Tulisokibart (PRA023) improved the clinical symptoms of DSS-induced acute colitis. The results indicate that B-hTL1A mice are a powerful tool for assessing the in vivo efficacy of anti-human TL1A antibodies. Values are expressed as mean ± SEM. *p<0.05, **p<0.01, ***p<0.001, ****p<0.0001 versus Vehicle, ANOVA.
Note: This experiment was conducted by WuXi AppTec using B-hTL1A mice.
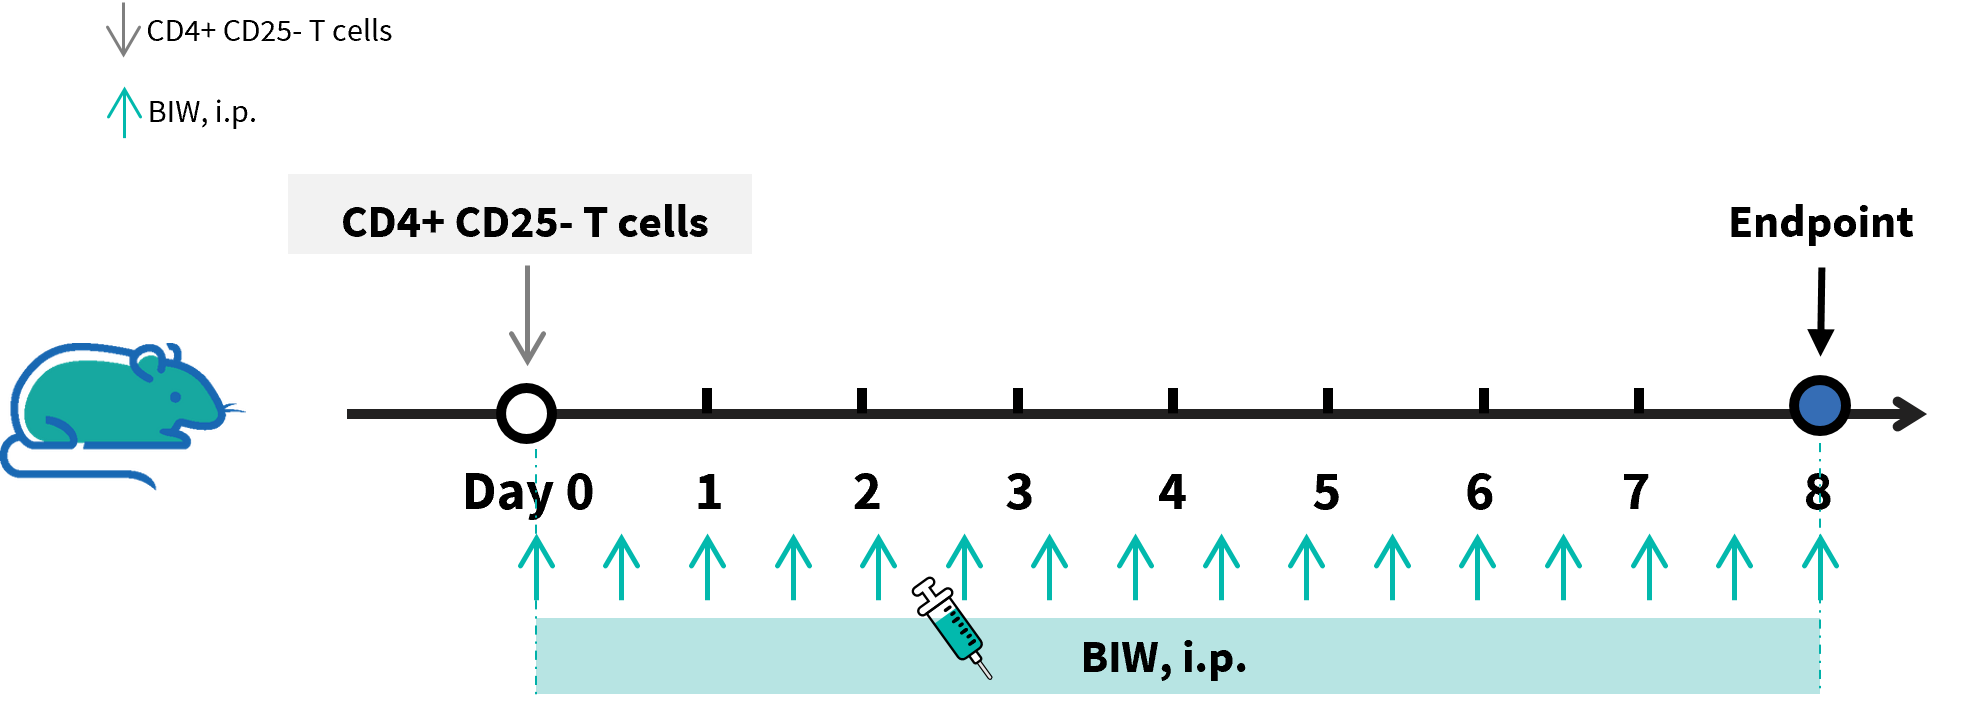
In Vivo Efficacy of Anti–TL1A Antibody in CD4+ CD25- T Cells Transfer Induced Colitis
Experimental schedule for CD4+ CD25- T cells transfer induced colitis and in vivo efficacy of anti-TL1A antibody in B-hTL1A mice. CD4+CD25- T cells were isolated from the spleens of B-hTL1A mice using commercial kits. B-Rag2 KO animals in groups G2-G3 were injected with 6×10⁵ CD4+CD25- T cells, while B-Rag2 KO animals in group G1 were injected with the same volume of PBS. Animals in group G3 were given 25 mg/kg of anti-TL1A antibody PF06480605 (commercially purchased) twice a week.
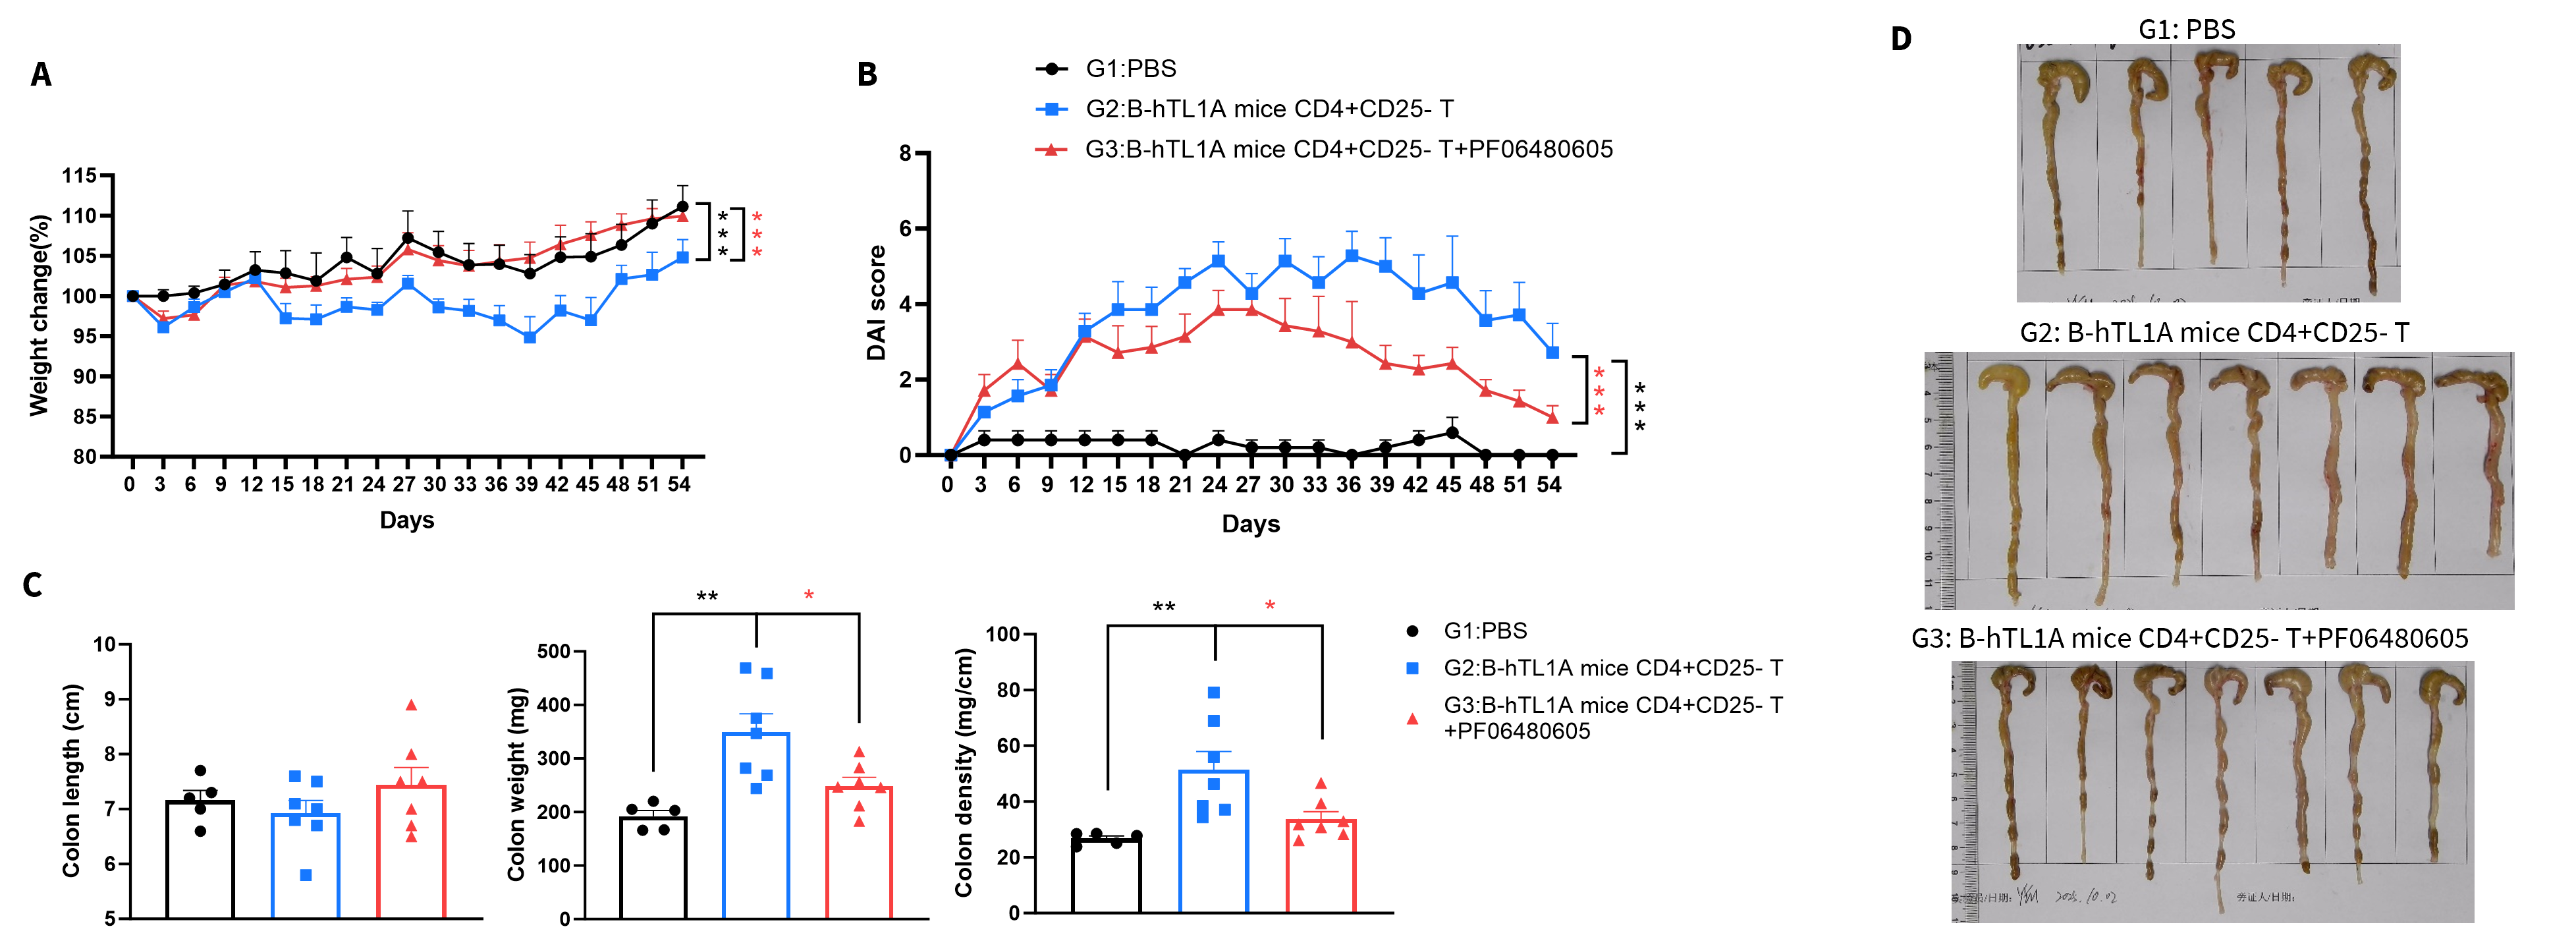
- PF06480605 treatment efficiently improved CD4+ CD25- T cells transfer induced colitis.
The therapeutic efficacy of PF06480605 on CD4+ CD25- T cells transfer induced colitis model in B-hTL1A mice. Body weight and DAI score were recorded every three days. On day 54, the mice were sacrificed, colon length and weight were recorded. (A) Body weight change. (B) DAI score. (C) Colon index. (D) Colon photo. Administration of anti-TL1A antibody PF06480605 (commercially purchased) effectively improved T cells-induced colitis, Two-way ANOVA or one-way ANOVA was used for multiple comparisons, with each group compared to group G2. Values are expressed as mean ± SEM. *p<0.05, **p<0.01, ***p<0.001.
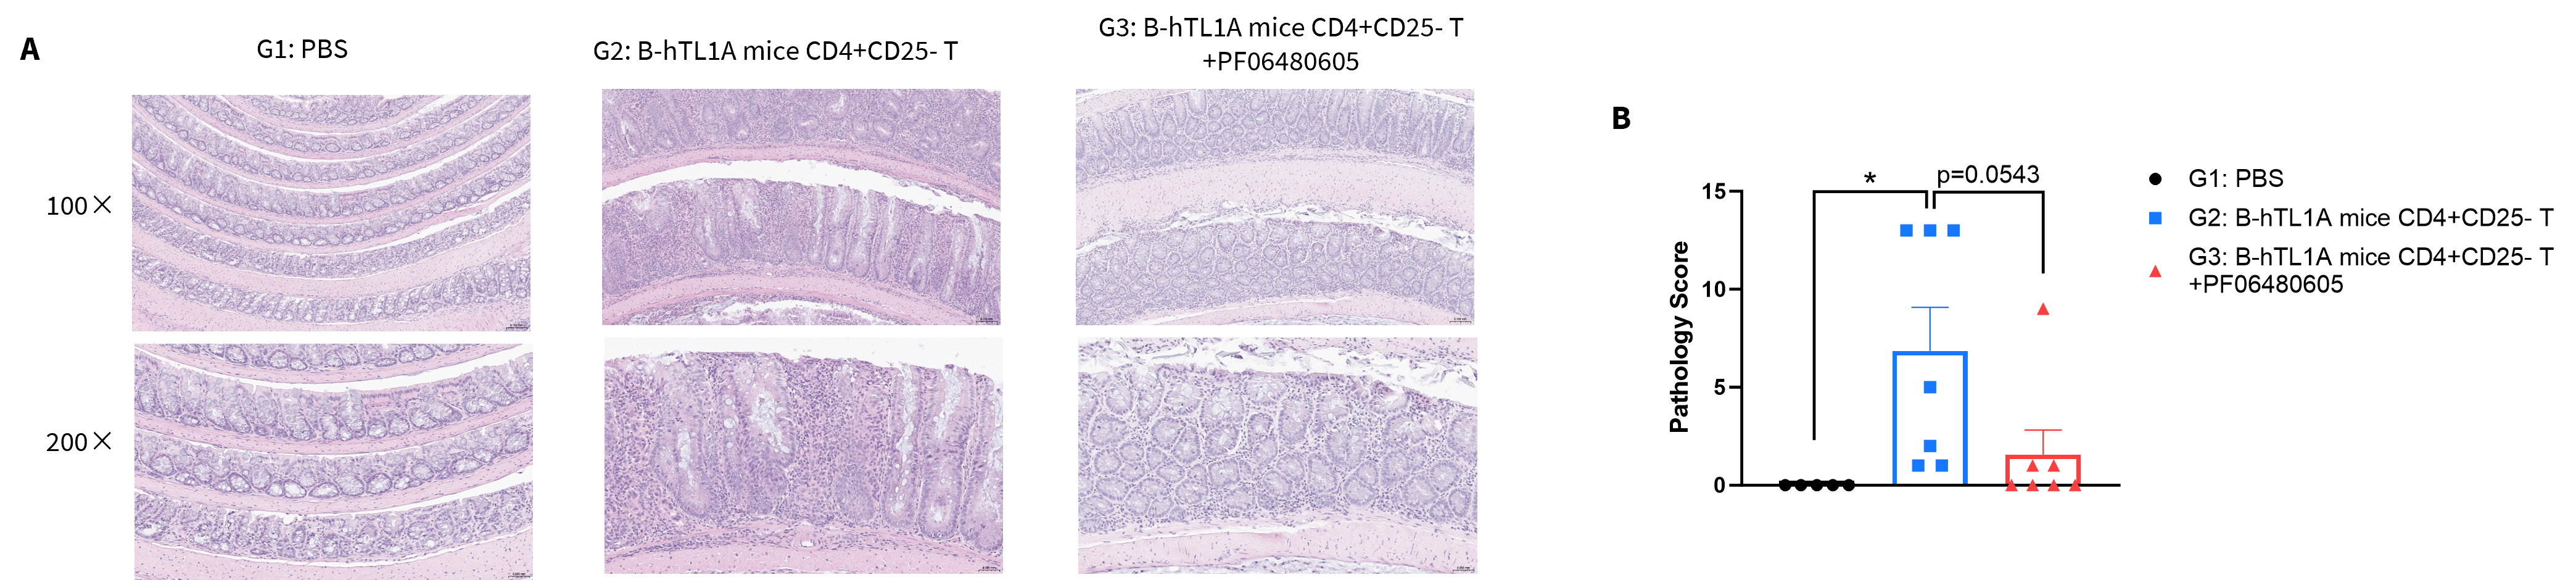
- PF06480605 significantly reduced inflammatory infiltration and epithelial damage in colon tissue compared with untreated controls (G2).
H&E staining of CD4+ CD25- T cells transfer induced colitis model in B-hTL1A mice. Colon tissues were collected at the study endpoint and analyzed by H&E staining. (A) H&E staining of colon tissue. (B) Pathological score. One-way ANOVA was used for multiple comparisons, with each group compared to group G2. Values are expressed as mean ± SEM. *p<0.05, **p<0.01, ***p<0.001.
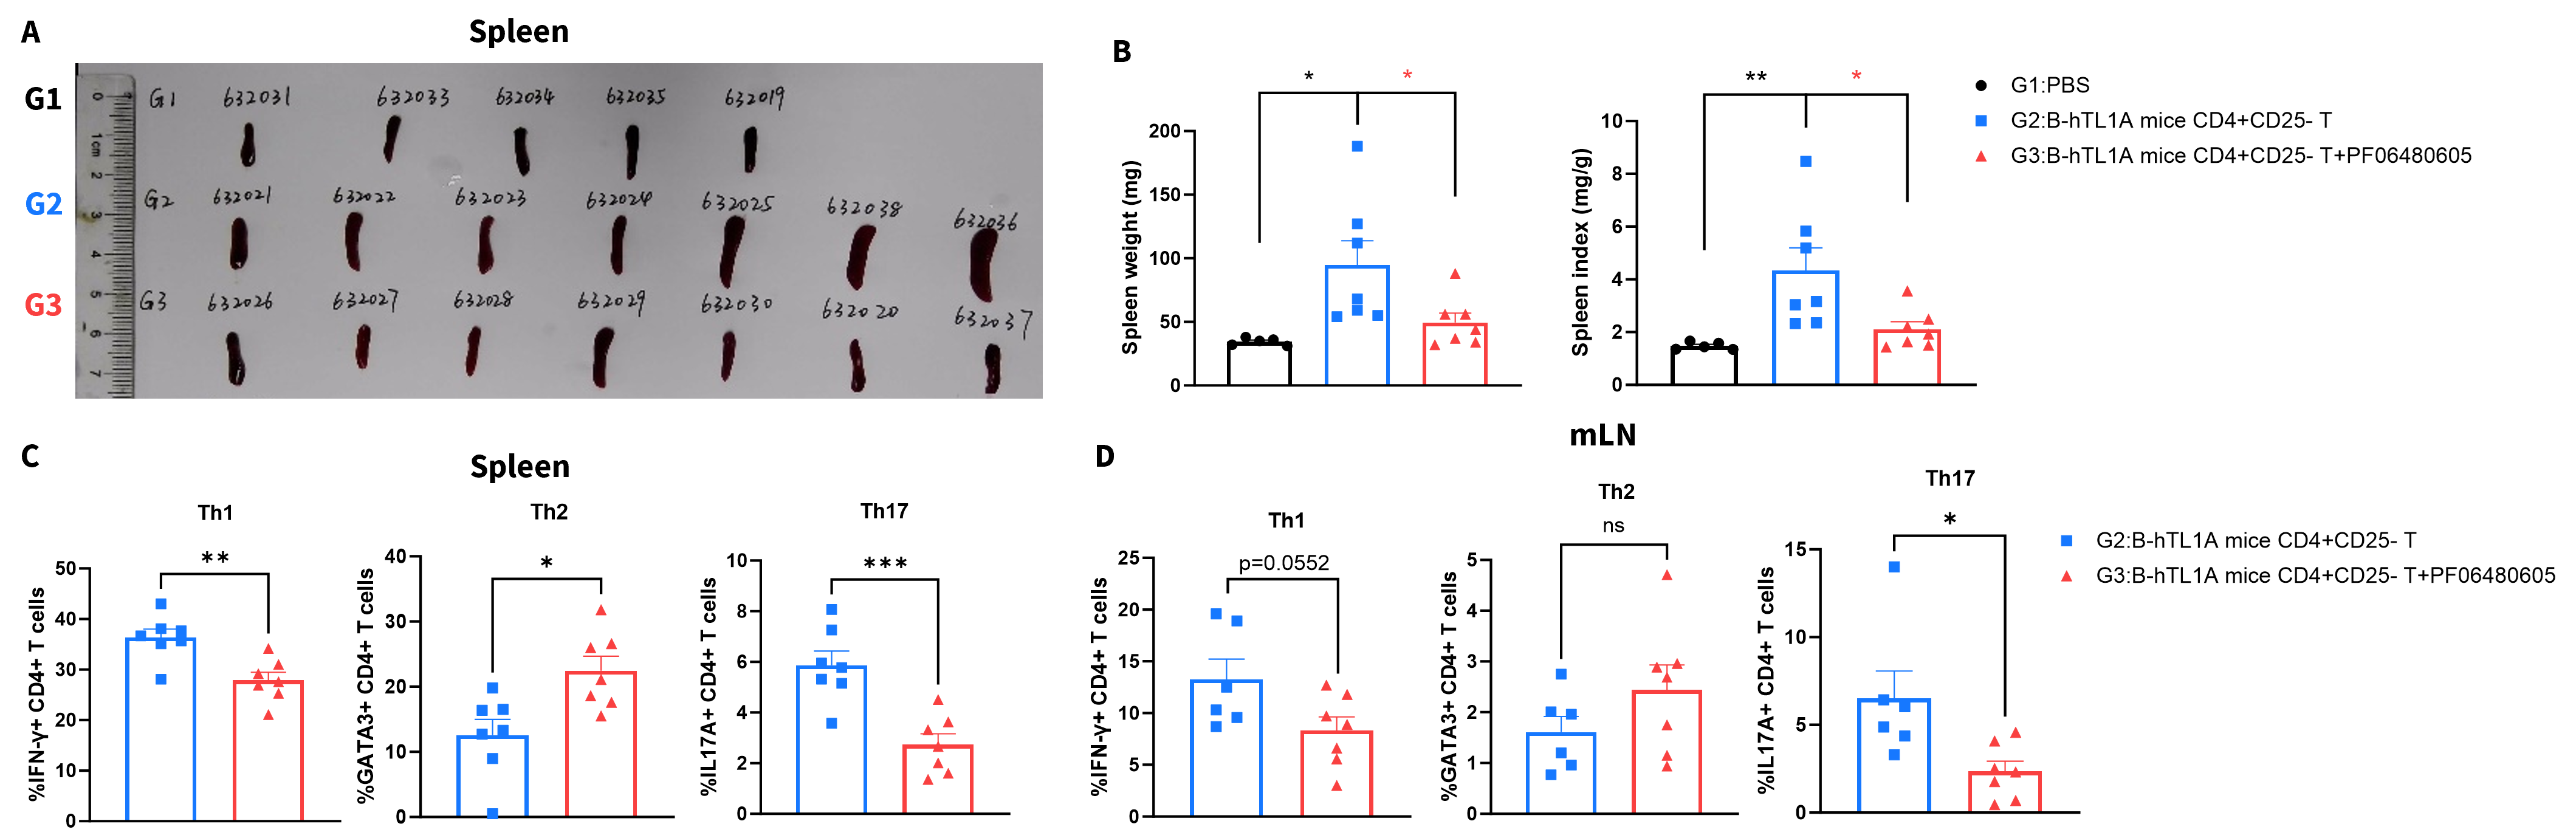
- PF06480605 significantly reduced spleen index and percentages of Th1, Th17 cells compared with untreated controls (G2).
Analysis of spleen index and CD4 T cell subtypes in CD4+ CD25- T cells transfer induced colitis model in B-hTL1A mice. Spleen and mesenteric lymph node (mLN) tissues were collected at the study endpoint. (A) Spleen photo. (B) Spleen index. (C) Percentages of Th1, Th2 and Th17 cells in spleen. (D) Percentages of Th1, Th2 and Th17 cells in mLNs. One-way ANOVA was used for multiple comparisons, with each group compared to group G2. Values are expressed as mean ± SEM. *p<0.05, **p<0.01, ***p<0.001.
* When publishing results obtained using this animal model, please acknowledge the source as follows: The animal model [B-hTL1A mice] (Cat# 111997) was purchased from Biocytogen.