


VEGFR2: A central regulator of angiogenesis and its therapeutic intervention
Gene Information: Vascular endothelial growth factor receptor 2 (VEGFR2), also known as KDR or FLK1, is a protein-coding gene located on chromosome 4q12. It encodes a receptor tyrosine kinase belonging to the VEGFR family.
Protein Expression: VEGFR2 is primarily expressed on vascular endothelial cells, lymphatic endothelial cells, and hematopoietic cells. It predominantly exists as a full-length transmembrane receptor, serving as the main transducer of angiogenic signals.
Signaling Pathway: VEGFR2 binds VEGFA, VEGFC, and VEGFD, utilizing NP1/2 as co-receptors. It possesses strong tyrosine kinase activity and plays a primary role in mediating vascular permeability, endothelial cell proliferation, migration, and survival..
Therapeutic Inhibition: By blocking VEGFR2 binding, dimerization, or kinase activity with monoclonal antibodies or tyrosine kinase inhibitors, downstream signaling and cell migration are inhibited, offering a major strategy for anti-angiogenic therapy.
Complete Human Pathway: Single-target humanization of VEGFR2 preserves native human receptor signaling, including the membrane-bound and soluble sVEGFR2 isoforms, enabling precise in vivo evaluation.
IND-Enabling Data Package: Provides a robust platform for generating preclinical safety and efficacy data to support IND submissions for anti-VEGFR2 therapeutics.
Versatile Disease Modeling: Enables robust in vivo modeling of VEGFR2-driven tumor angiogenesis, pathological vascular permeability, and tumor microenvironment remodeling.
Target & Pathway Validation: Enables study of the VEGFR2/VEGF-A/C/D axis and its downstream signaling cascades (e.g., PLCγ-PKC, PI3K-AKT-eNOS) in endothelial cells.
Efficacy & Safety Evaluation: Supports efficacy and safety assessment of anti-hVEGFR2 antibodies and multi-targeted tyrosine kinase inhibitors in disease models.
Novel Therapeutic Screening: Facilitates the discovery and screening of novel anti-angiogenic agents and vascular normalization strategies, leveraging a humanized model for translational research.


VEGFR2
The exons 2-15 of mouse Kdr gene that encodes the extracellular region coding sequences were replaced by human KDR exons 2-15 in B-hVEGFR2 mice.

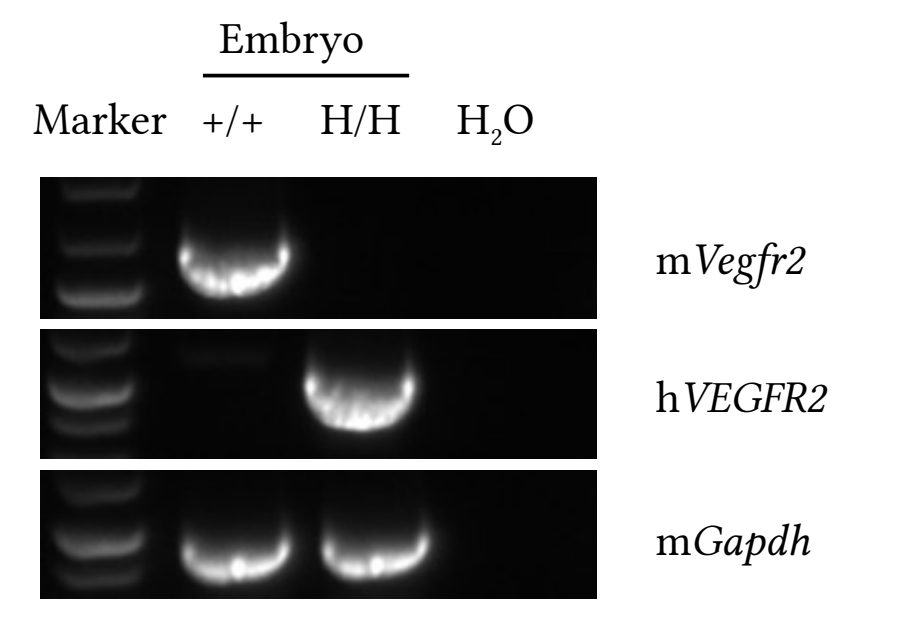
Strain specific analysis of VEGFR2 gene expression in wild type and B-hVEGFR2 mice by RT-PCR. Embryo were isolated from wild-type C57BL/6 mice (+/+) and homozygous B-hVEGFR2 mice (H/H). Primers were designed to detect human VEGFR2 and mouse Vegfr2.
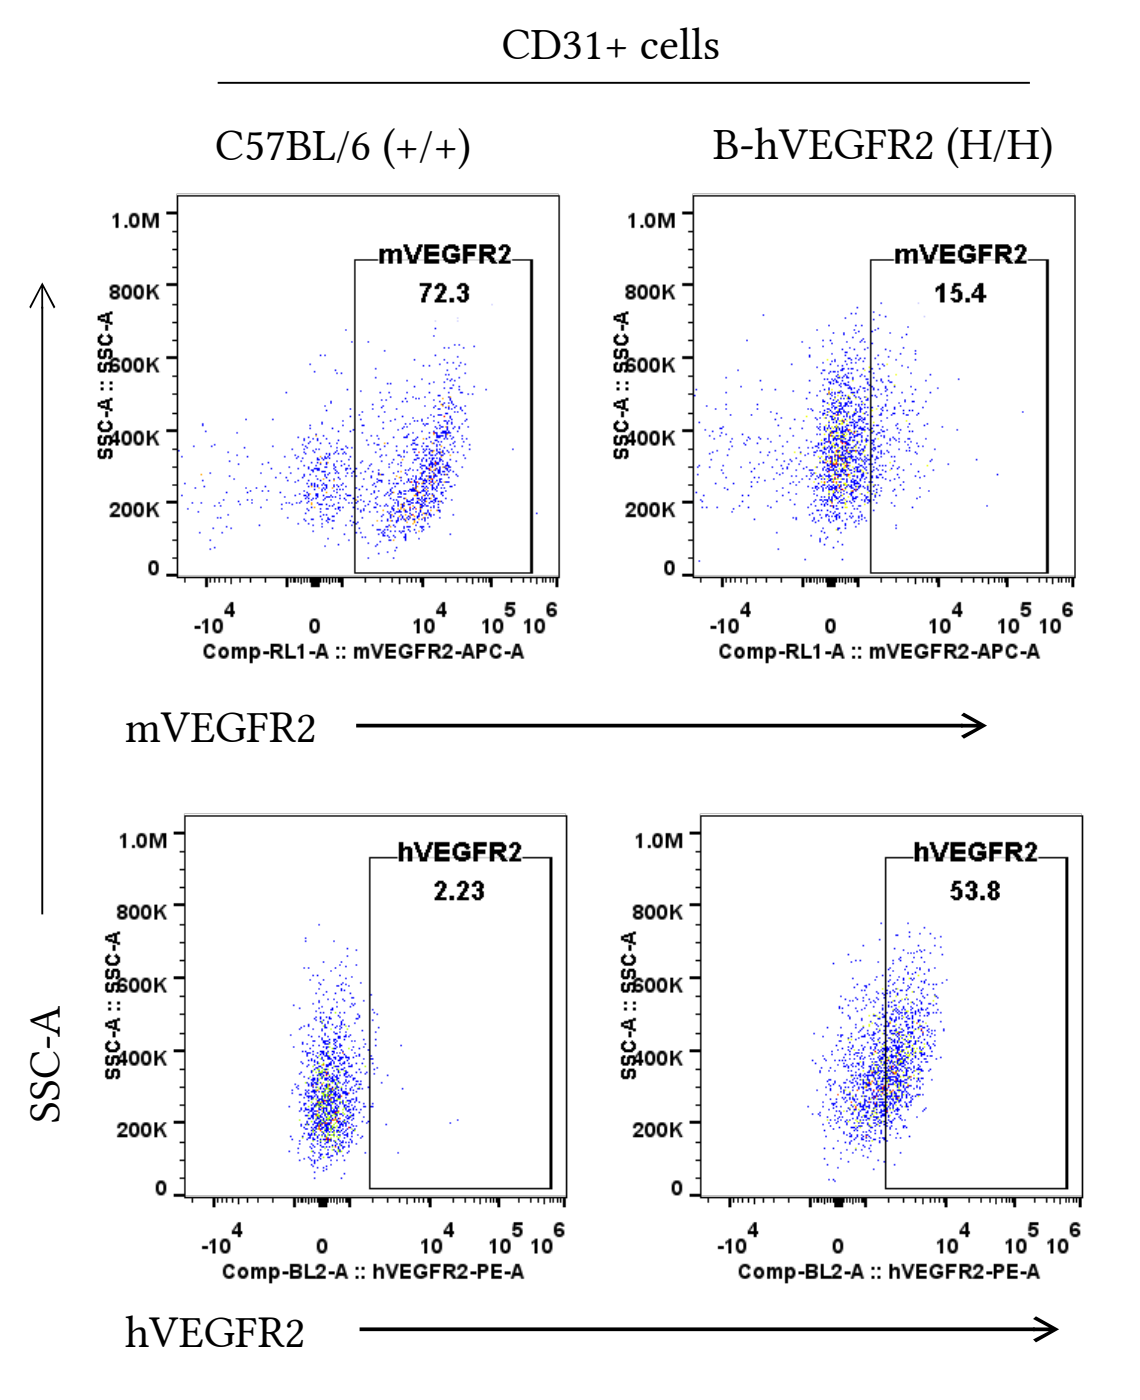
Strain specific VEGFR2 expression analysis in homozygous B-hVEGFR2 mice by flow cytometry.
Embryonic lung endothelial cells were collected from wild-type (+/+) and homozygous B-hVEGFR2 mice (H/H) analyzed by flow cytometry with anti-human VEGFR2 antibody (RD, FAB357P-025) and anti-mouse VEGFR2 antibody (Biolegend, 136405). Anti-mouse VEGFR2 antibody was cross-reactive between mouse and human.
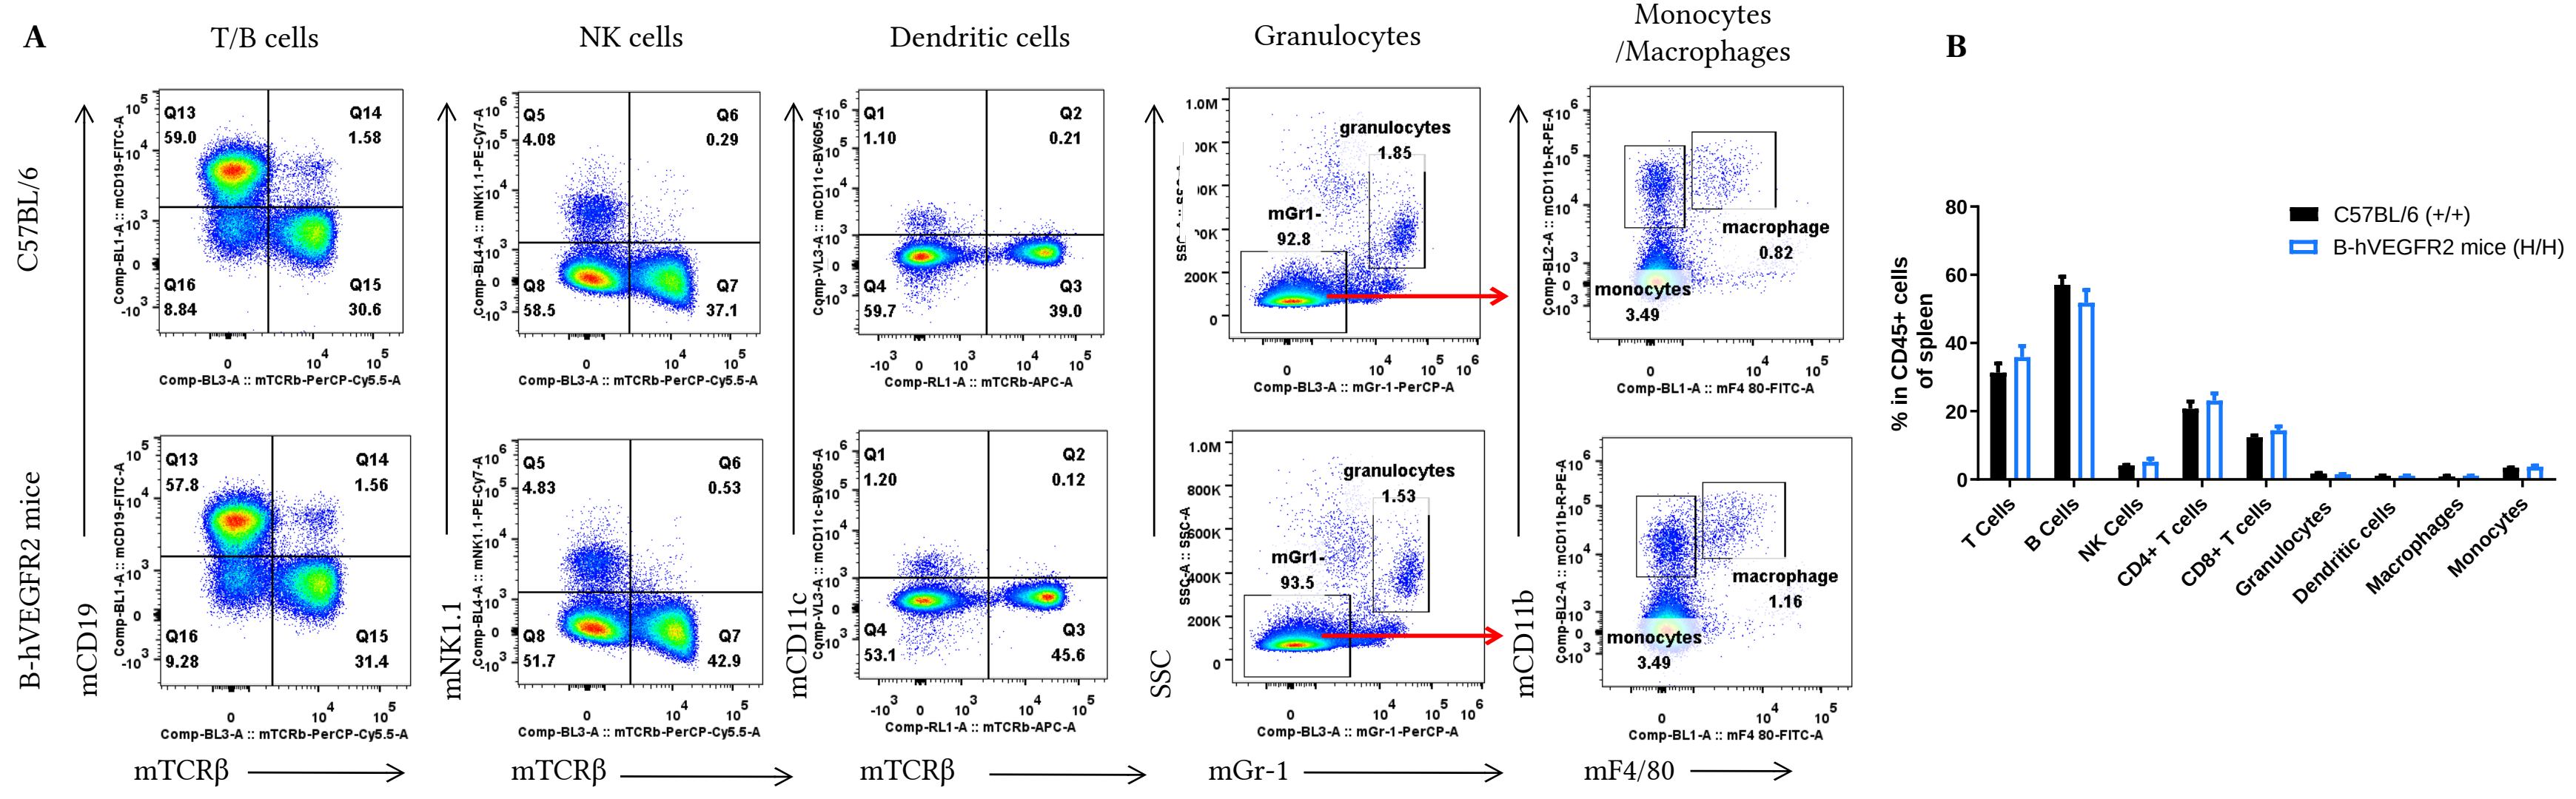
Analysis of spleen leukocyte subpopulations by FACS. Splenocytes were isolated from female C57BL/6 and B-hVEGFR2 mice (n=3, 6-week-old). Flow cytometry analysis of the splenocytes was performed to assess leukocyte subpopulations. A. Representative FACS plots. Single live cells were gated for the CD45+ population and used for further analysis as indicated here. B. Results of FACS analysis. Values are expressed as mean ± SEM.
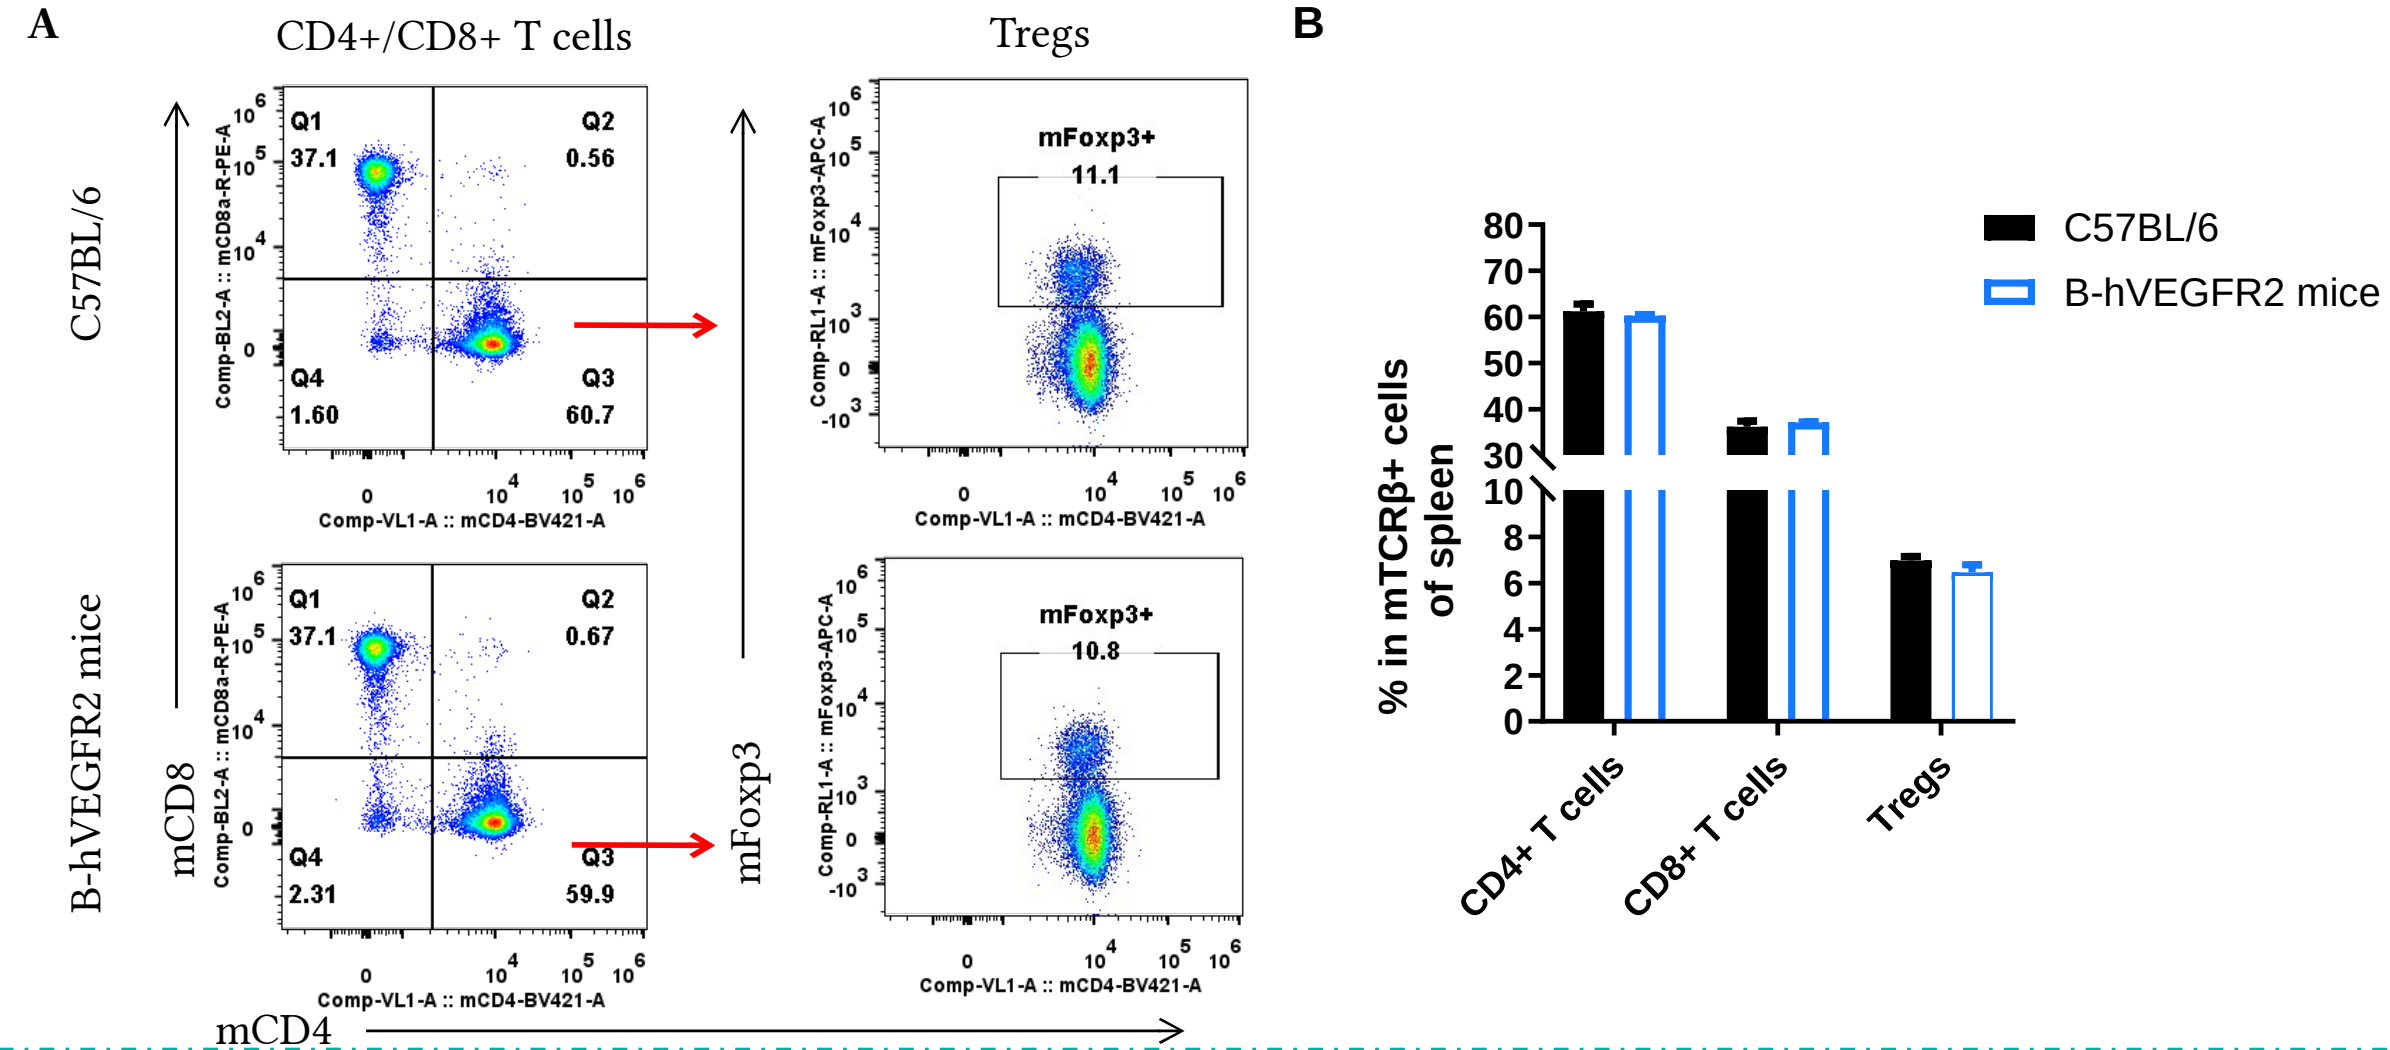
Analysis of T-cell subpopulations by flow cytometry in spleen. Splenocytes were isolated from female C57BL/6 and B-hVEGFR2 mice (n=3, 6-week-old). Flow cytometry analysis of the splenocytes was performed to assess leukocyte subpopulations. A. Representative FACS plots. Single live CD45+ cells were gated for TCRβ+ T cell population and used for further analysis as indicated here. B. Results of FACS analysis. Values are expressed as mean ± SEM.
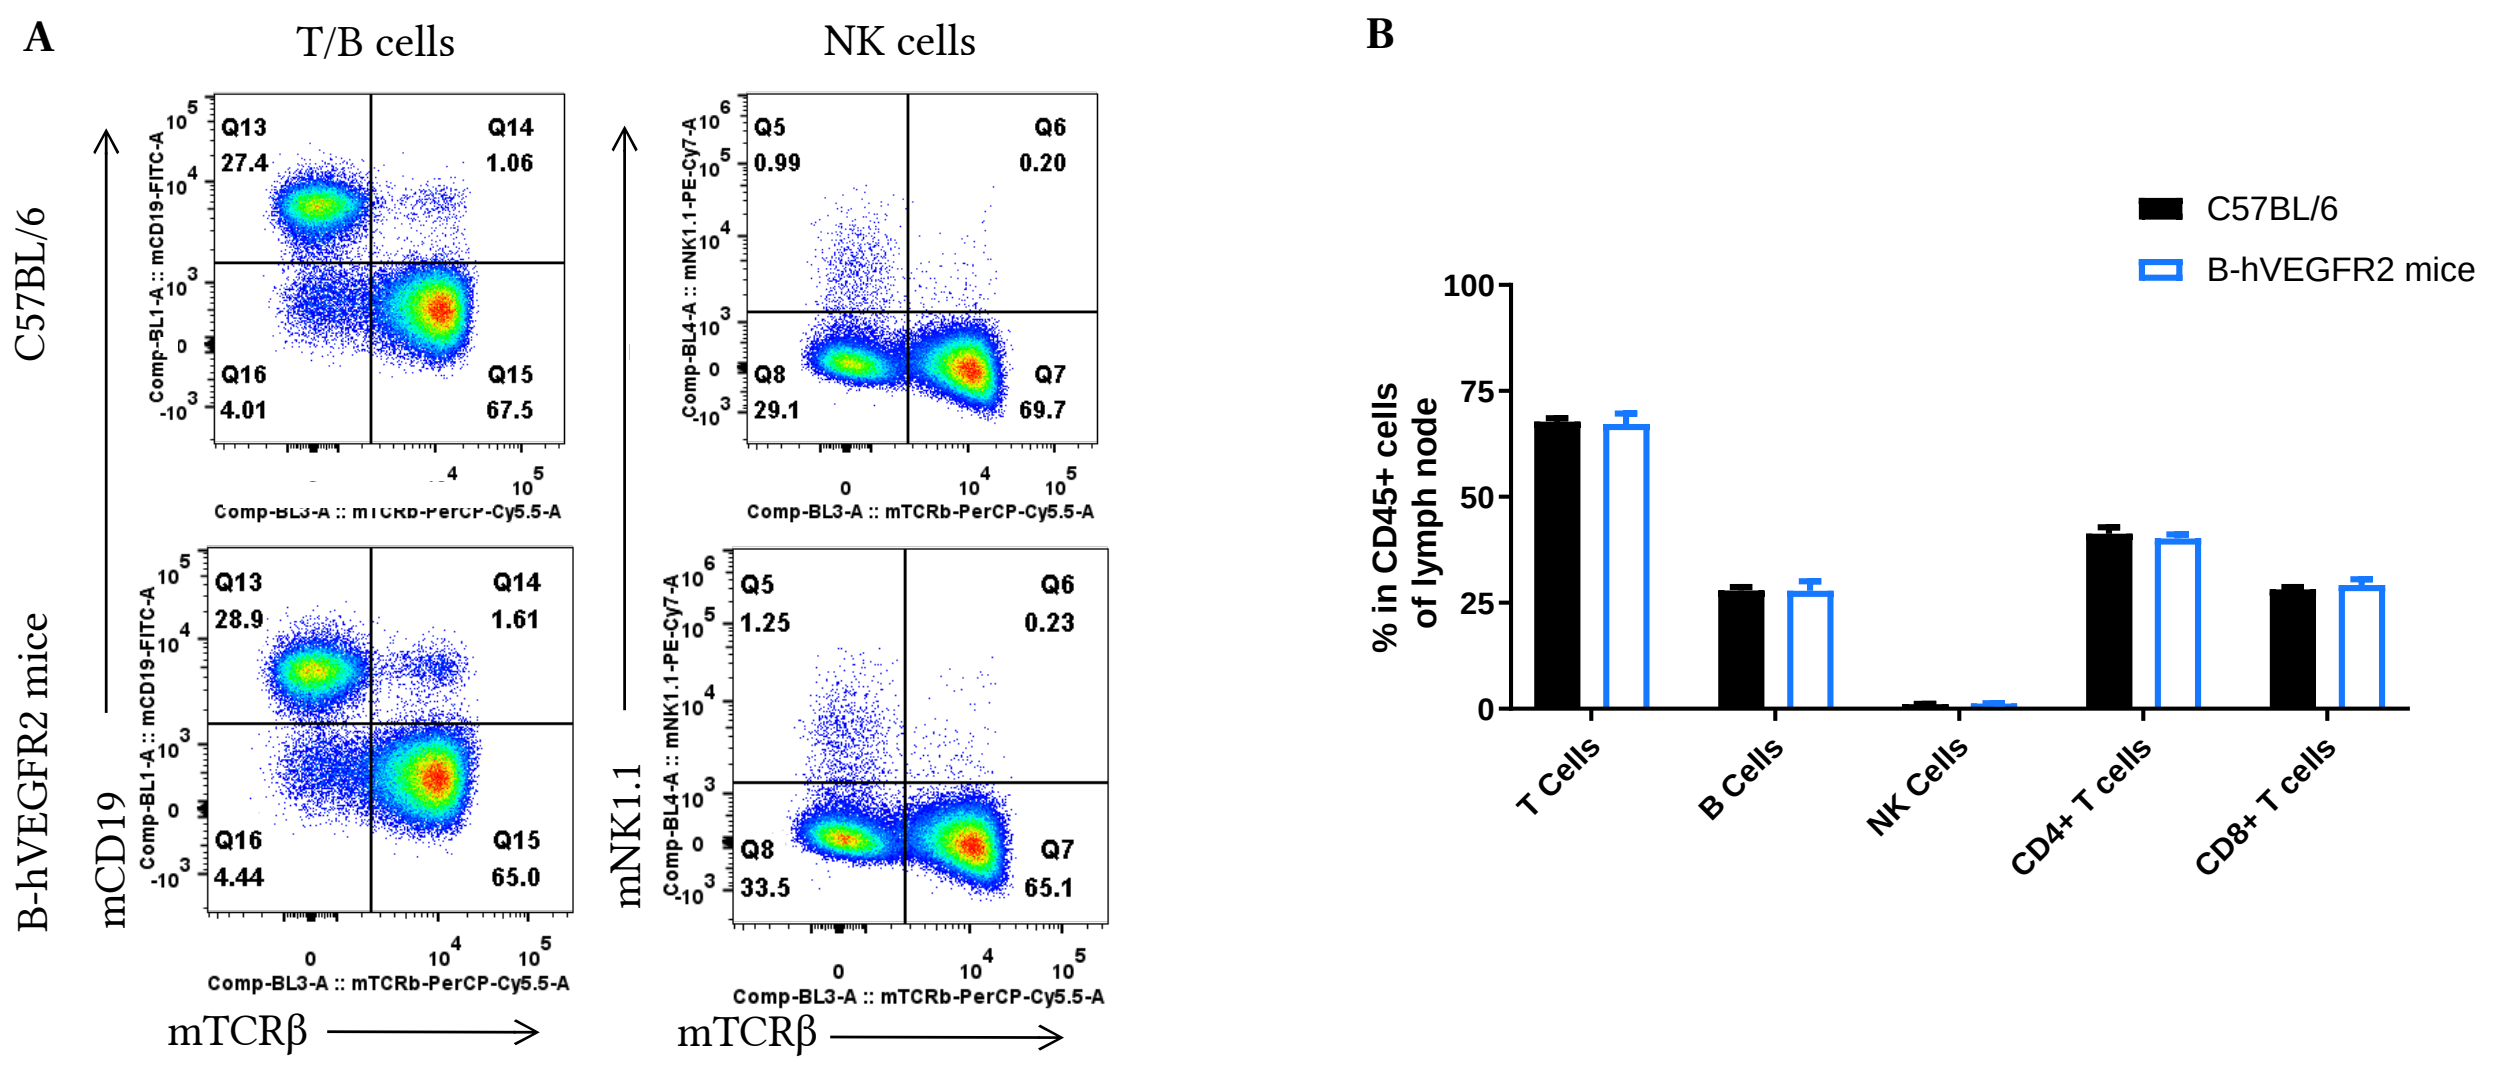
Analysis of lymph nodes leukocyte subpopulations by FACS. Lymph node cells were isolated from female C57BL/6 and B-hVEGFR2 mice (n=3, 6-week-old). Flow cytometry analysis of the leukocytes was performed to assess leukocyte subpopulations. A. Representative FACS plots. Single live cells were gated for the CD45+ population and used for further analysis as indicated here. B. Results of FACS analysis. Values are expressed as mean ± SEM.
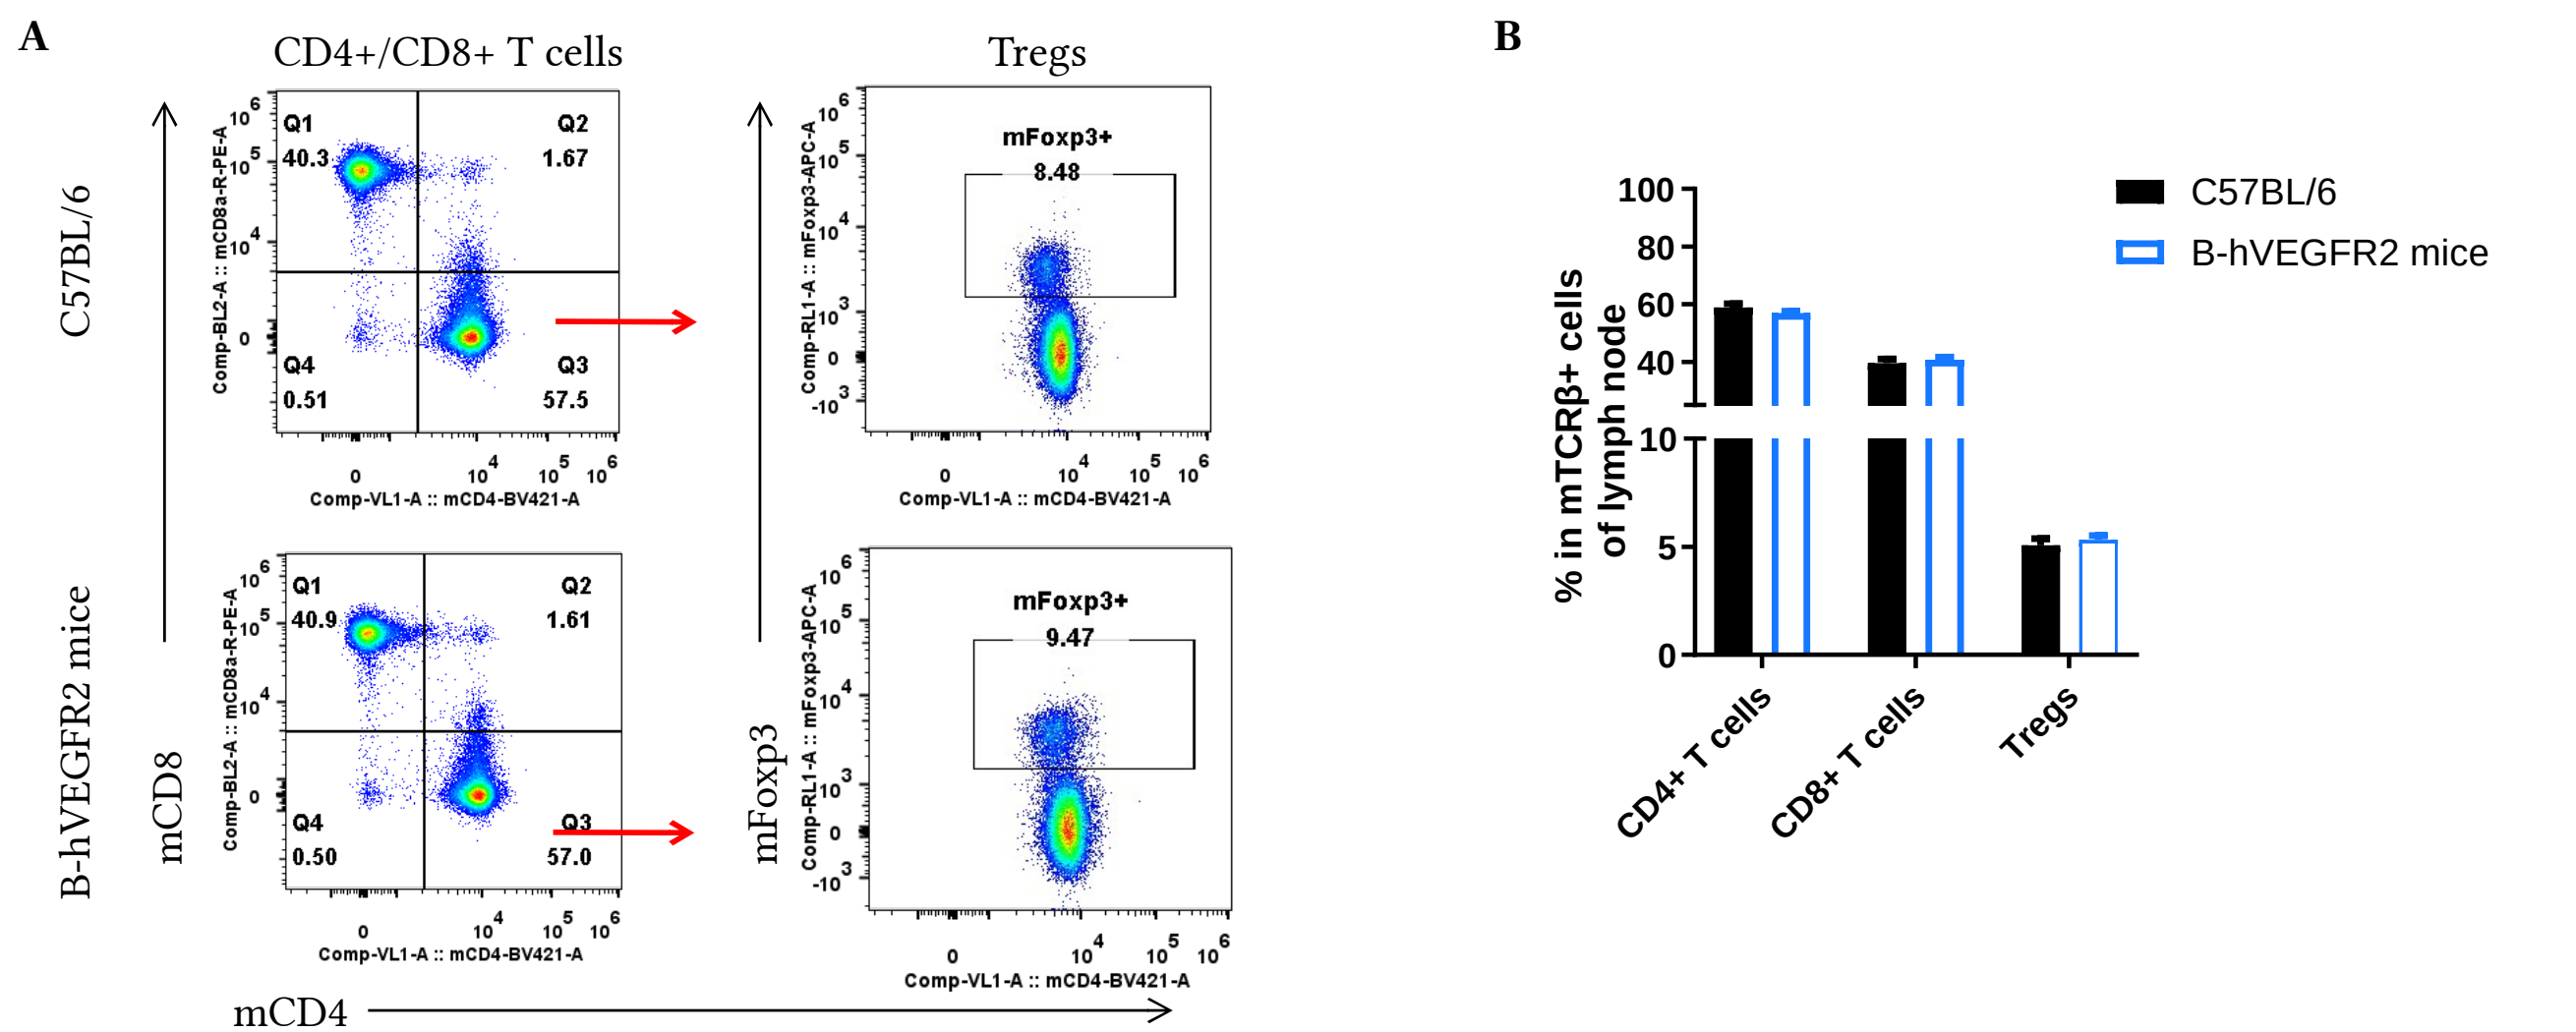
Analysis of lymph nodes T cell subpopulations by FACS. Lymph node cells were isolated from female C57BL/6 and B-hVEGFR2 mice (n=3, 6-week-old). Flow cytometry analysis of the leukocytes was performed to assess leukocyte subpopulations. A. Representative FACS plots. Single live CD45+ cells were gated for TCRβ+ T cell population and used for further analysis as indicated here. B. Results of FACS analysis. Values are expressed as mean ± SEM.
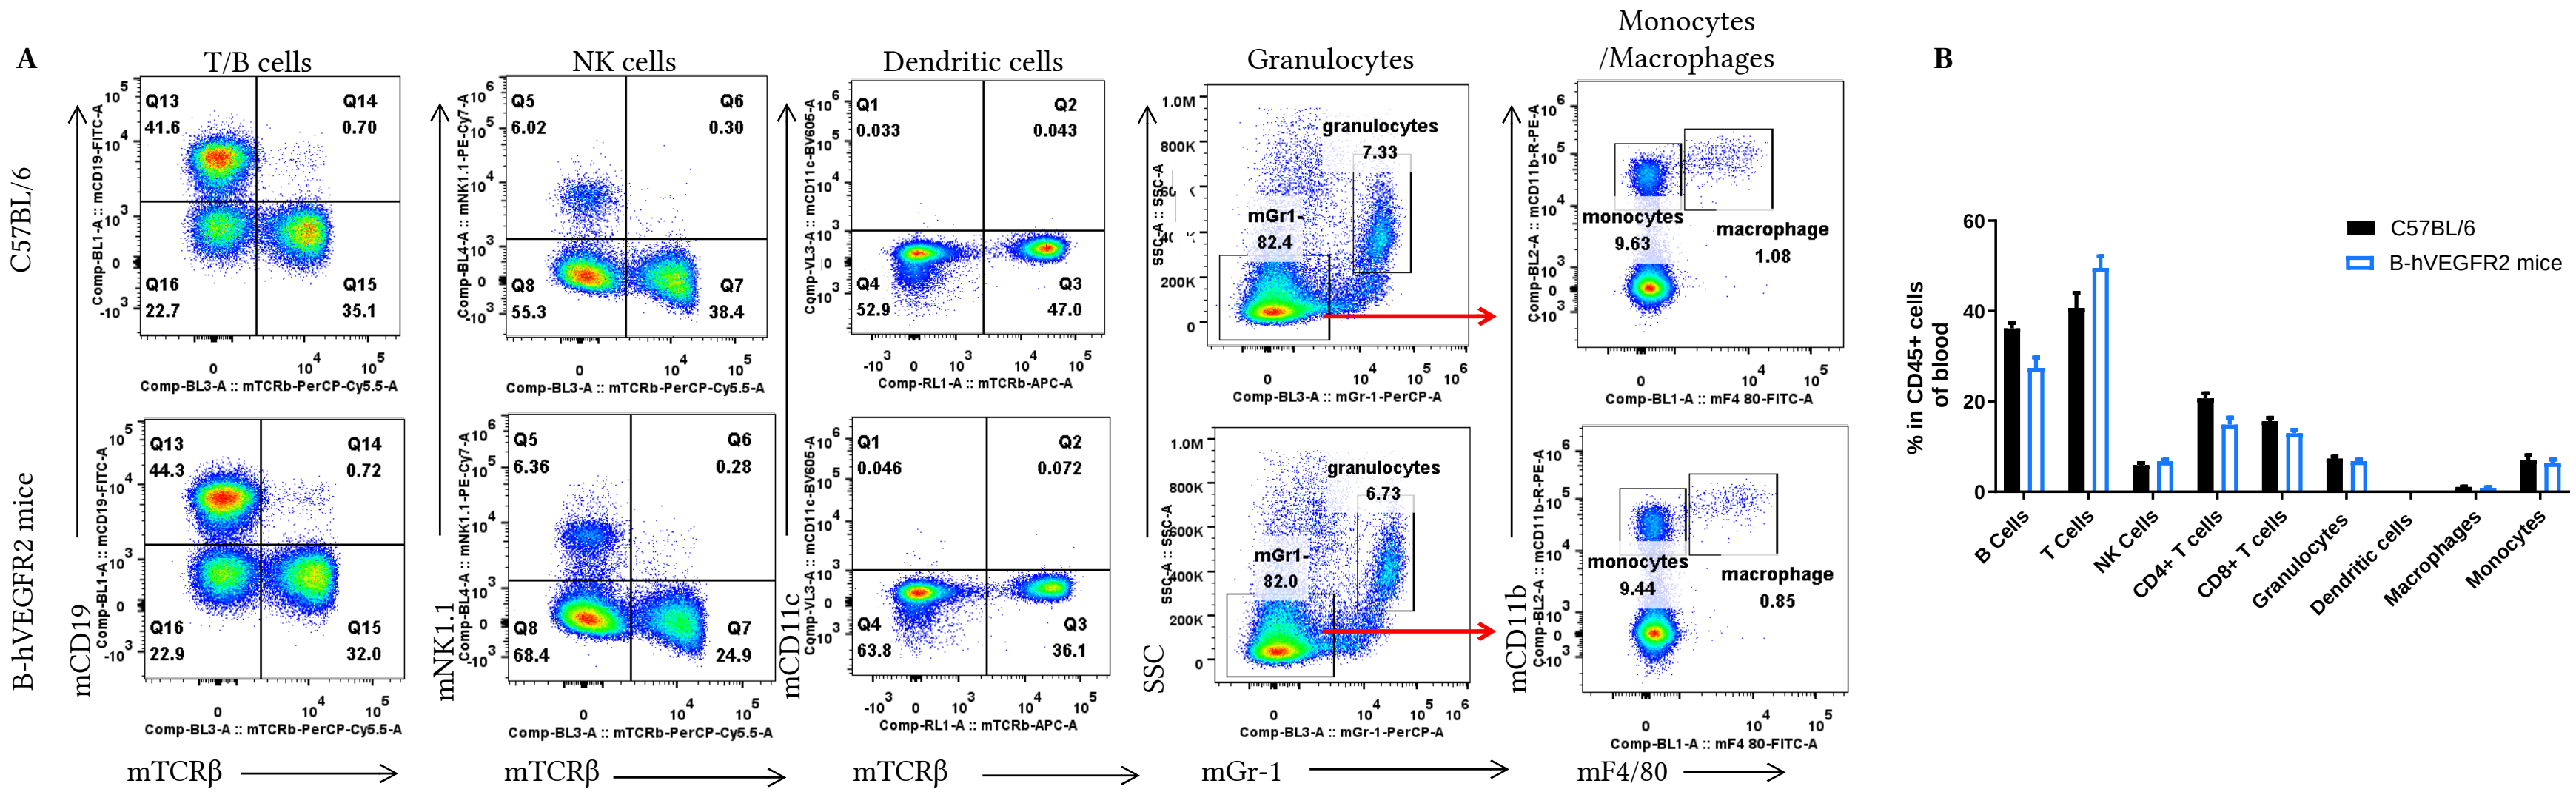
Analysis of blood leukocyte subpopulations by FACS. Blood cells were isolated from female C57BL/6 and B-hVEGFR2 mice (n=3, 6-week-old). Flow cytometry analysis of the blood cells were performed to assess leukocyte subpopulations. A. Representative FACS plots. Single live cells were gated for the CD45+ population and used for further analysis as indicated here. B. Results of FACS analysis. Values are expressed as mean ± SEM.
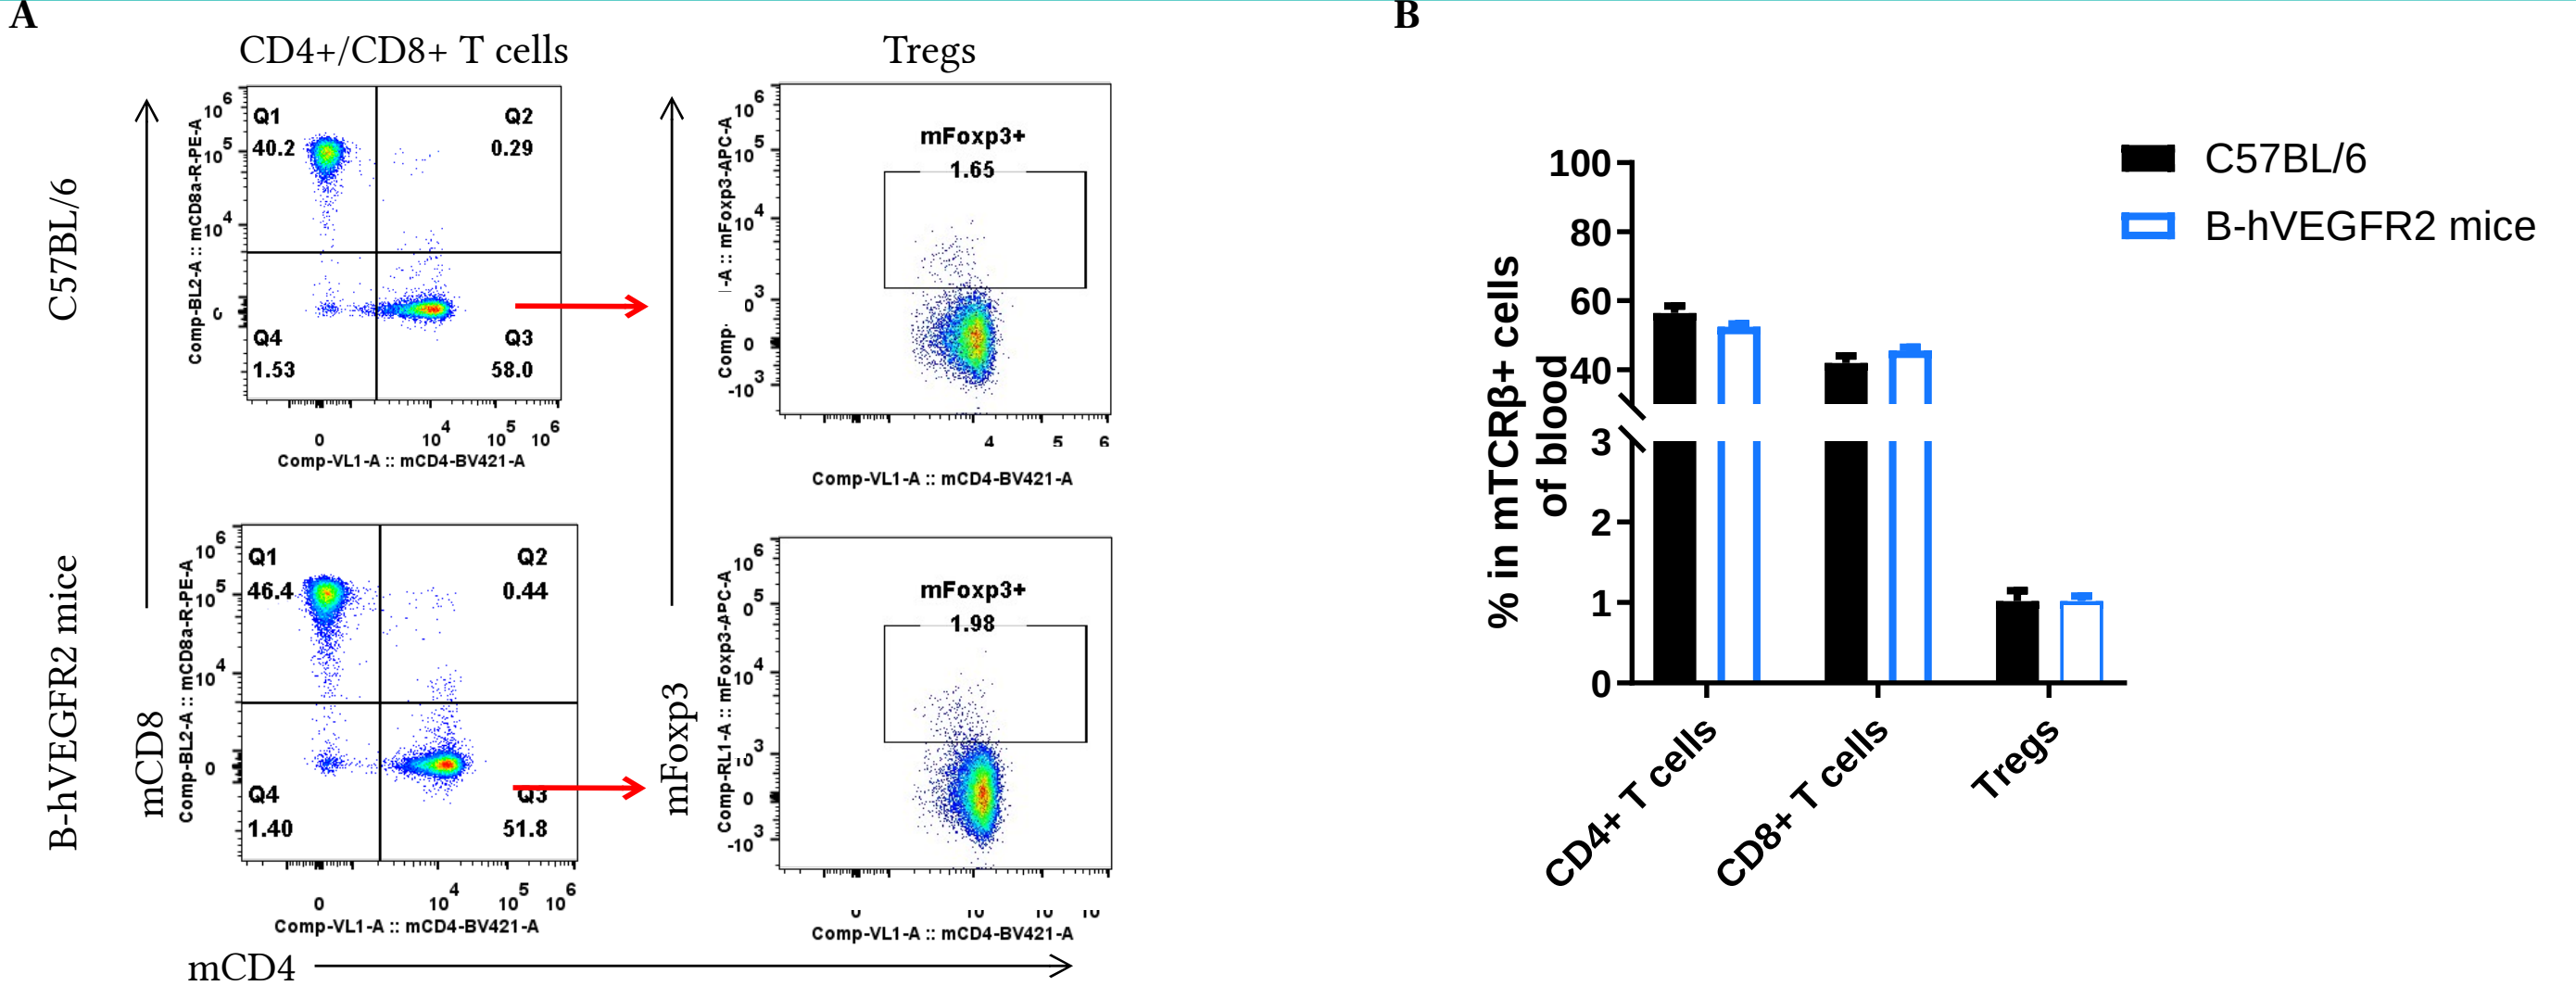
Analysis of blood T cell subpopulations by FACS. Blood cells were isolated from female C57BL/6 and B-hVEGFR2 mice (n=3, 6-week-old). Flow cytometry analysis of the blood cells were performed to assess leukocyte subpopulations. A. Representative FACS plots. Single live CD45+ cells were gated for TCRβ+ T cell population and used for further analysis as indicated here. B. Results of FACS analysis. Values are expressed as mean ± SEM.

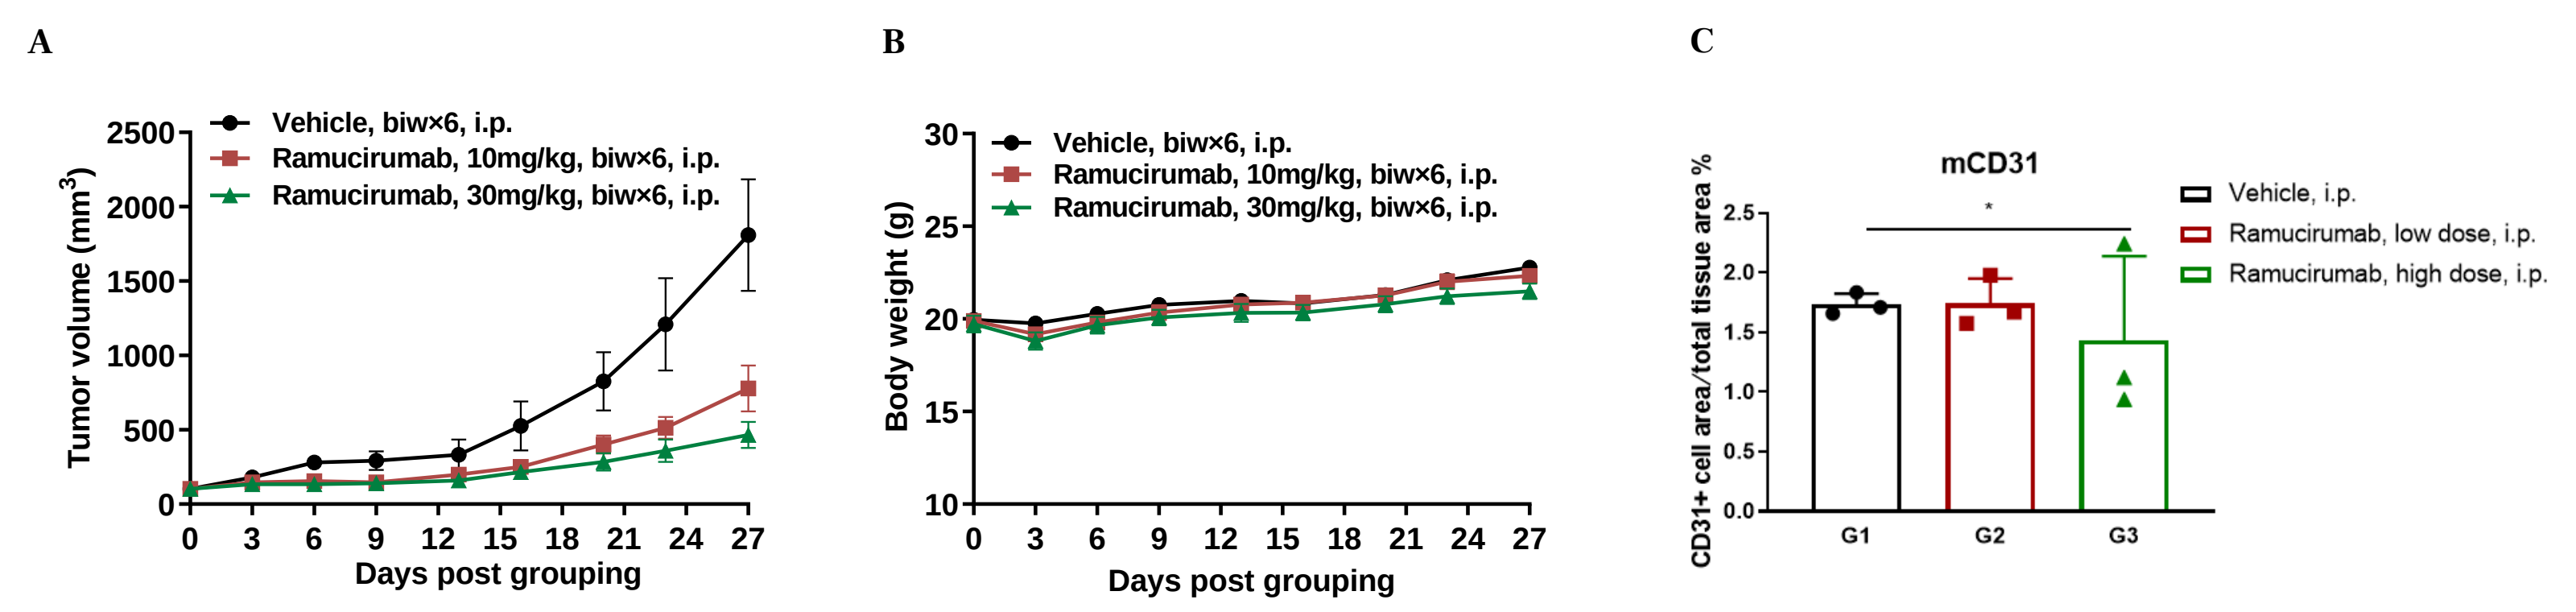
Antitumor activity of anti-human VEGFR2 antibody in B-hVEGFR2 mice. (A) Ramucirumab (in house) inhibited MC38 tumor growth in B-hVEGFR2 mice. Murine colon cancer MC38 cells were subcutaneously implanted into homozygous B-hVEGFR2 mice (female, 8-week-old, n=6). Mice were grouped when tumor volume reached approximately 100 mm3, at which time they were treated with Ramucirumab (in house) with doses and schedules in panel A. (B) Body weight changes during treatment. (C) Proportion of CD31-positive cell area of total area analyzed in tumor tissue. As shown in panel A, anti-human VEGFR2 antibody was efficacious in controlling tumor growth in B-hVEGFR2 mice, demonstrating that the B-hVEGFR2 mice provide a powerful preclinical model for in vivo evaluation of anti-human VEGFR2 antibodies. As shown in panel C, anti-human VEGFR2 antibody Ramucirumab inhibits vascular endothelial cell proliferation. Values are expressed as mean ± SEM.