


Synergistic Mechanisms of PD-1 Inhibitors and T-Cell Engagers (TCEs) in Cancer Immunotherapy
The combination of PD-1 inhibitors and T-cell engagers (TCEs) represents a powerful synergistic approach in cancer immunotherapy. While TCEs act as a precise bridge by directly binding tumor antigens and CD3 to activate T cells independently of MHC presentation, tumor cells often counter this by upregulating PD-L1, leading to T-cell exhaustion. PD-1 inhibitors block this suppressive pathway, ensuring that activated T cells remain potent and proliferative in the tumor microenvironment. Together, TCEs drive targeted cytotoxicity, while PD-1 inhibitors prevent immune exhaustion, delivering a durable and enhanced anti-tumor response.

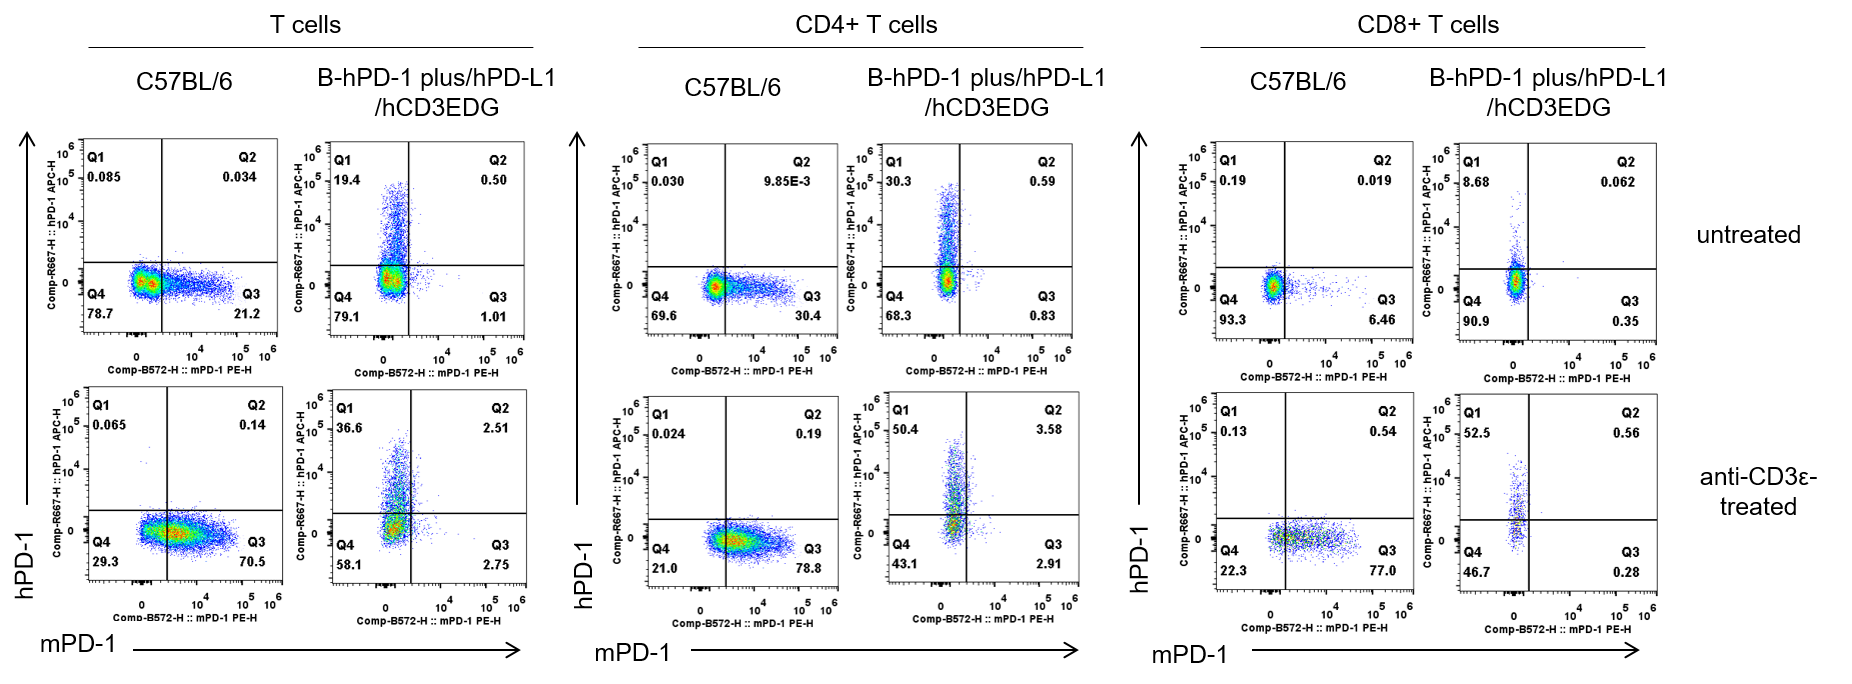
Strain specific PD-1 expression analysis in homozygous B-hPD-1 plus/hPD-L1/hCD3EDG mice by flow cytometry. Splenocytes were collected from C57BL/6 mice and homozygous B-hPD-1 plus/hPD-L1/hCD3EDG mice, either untreated (upper panel) or treated (lower panel) with anti-CD3ε in vivo (7.5 μg per mouse, 24 hours, i.p.). Cells were analyzed by flow cytometry using species-specific antibodies: anti-mouse PD-1 (Biolegend, 109104) and anti-human PD-1 (Biolegend, 329908).
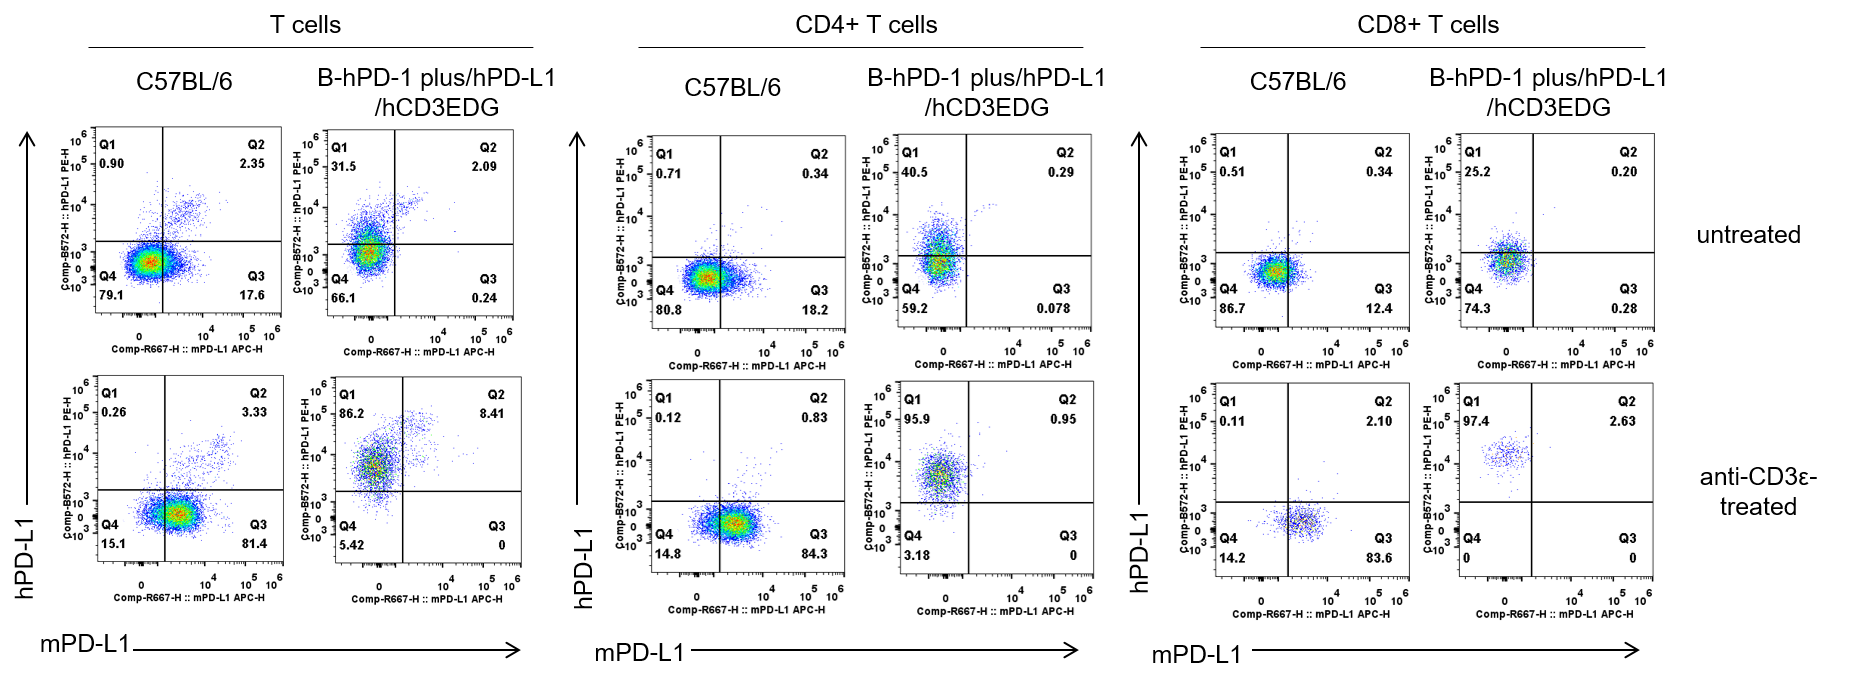
Strain specific PD-L1 expression analysis in homozygous B-hPD-1 plus/hPD-L1/hCD3EDG mice by flow cytometry. Splenocytes were collected from C57BL/6 mice and homozygous B-hPD-1 plus/hPD-L1/hCD3EDG mice, either untreated (upper panel) or treated (lower panel) with anti-CD3ε in vivo (7.5 μg per mouse, 24 hours, i.p.). Cells were analyzed by flow cytometry using species-specific antibodies: anti-mouse PD-L1 (Biolegend, 124312) and anti-human PD-L1 (Biolegend, 329706). Mouse PD-L1 was detectable in C57BL/6 mice, while human PD-L1 was exclusively detectable in homozygous B-hPD-1 plus/hPD-L1/hCD3EDG mice but not in C57BL/6 mice.
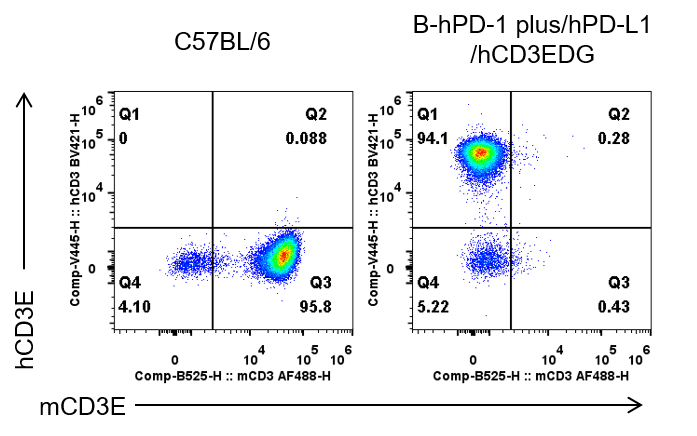
Strain specific CD3E expression analysis in homozygous B-hPD-1 plus/hPD-L1/hCD3EDG mice by flow cytometry. Splenocytes were collected from C57BL/6 mice and homozygous B-hPD-1 plus/hPD-L1/hCD3EDG mice, and analyzed by flow cytometry with species-specific anti-mouse CD3E antibody (Biolegend, 100321), and anti-human CD3E antibody (BD, 562426). Mouse CD3E was only detectable in wild-type C57BL/6 mice. Human CD3E was exclusively detectable in homozygous B-hPD-1 plus/hPD-L1/hCD3EDG mice.
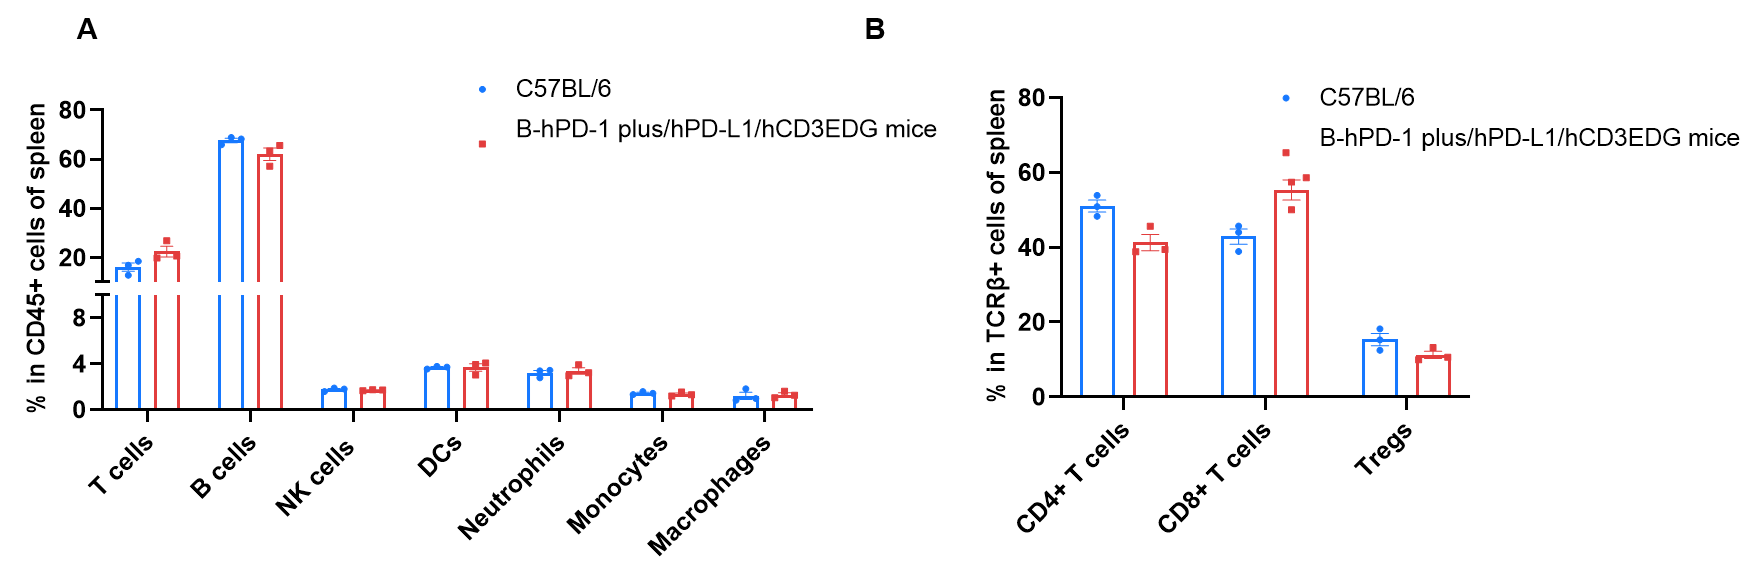
Frequency of leukocyte subpopulations in spleen by flow cytometry. Splenocytes were isolated from wild-type C57BL/6 mice (female, n=3, 8-week-old) and homozygous B-hPD-1 plus/hPD-L1/hCD3EDG mice (female, n=3, 8-week-old). A. Flow cytometry analysis of the splenocytes was performed to assess the frequency of leukocyte subpopulations. B. Frequency of T cell subpopulations. Values were expressed as mean ± SEM. Significance was determined by two-way ANOVA test. *P < 0.05, **P < 0.01, ***p < 0.001.